


Diagnostic Technologies Optimize Design, Performance Of Delaware Basin Completions
By Justin E. Parker, Van P. Tran, Lucas W. Bazan, Jonathan Thomas and Arden Renze
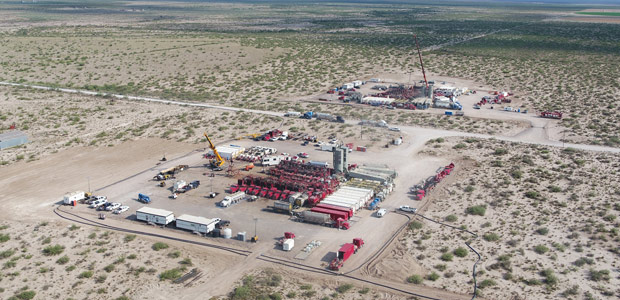
HOUSTON–Integrating diagnostics technologies with sound engineering practices can optimize completion design and improve well performance, as demonstrated by Noble Energy Inc.’s experience in the Delaware Basin of West Texas.
After entering the Permian Basin in 2015, Noble Energy developed an engineered hydraulic fracturing design for horizontal Wolfcamp wells using a discrete fracture network (DFN) model that utilizes integrated diagnostic technologies. The engineered design resulted in significant improvements to well performance, allowed for a systematic method to validate parameters and provided the basis-of-design for benchmarking well performance.
Since developing that initial approach, the company has integrated even more technologies into completion processes to enhance well performance, including rate transient analysis (RTA), applied post-job engineering analytics (APJA), pressure history matching (PHM), and post-fracture pressure matches to help refine the DFN model. The results of this fieldwide optimization work demonstrate the benefits of integrating multiple diagnostic technologies to design, analyze and optimize completion and fracture stimulation designs, and ultimately, increase recovery rates.
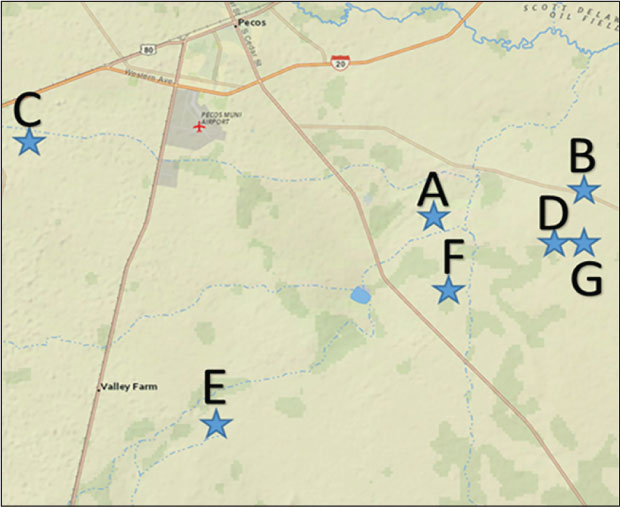
To evaluate completion efficiency and optimize fracture treatment design, Noble Energy conducted a six-well study in Reeves County, Tx. Figure 1 shows the locations of horizontal wells A-F, and vertical offset Well G used for data acquisition. The top of the Wolfcamp A ranges from 10,100 to 10,700 feet true vertical depth in this part of Reeves County, and generally consists of interbedded tight, fine-grained limestone and organic-rich siltstone with good lateral continuity. Thickness is between 240 and 310 feet.
FIGURE 1
Locations of Horizontal Field Trial Wells A-F And Vertical Offset Well G (Reeves County, Tx.)
The frequency of tight limestone beds is generally lowest in the upper one-third of the Wolfcamp A interval targeted in this subset of wells. This interval generally has total organic content values of 3-4 percent, porosity of 5-11 percent and core permeabilities of 10-1,000 nanodarcies. On average, the organic-rich siltstones make up 55 percent of the Wolfcamp A, having low density and elevated resistivity.
Enhancing Stimulation
Core data from vertical Well G was used to calibrate and enhance the confidence of the log-derived reservoir characteristics for calculating updated properties for DFN fracture modeling. Minor adjustments were required to calibrate with DFIT results conducted in the toe of Well B. The core points and calibrated logs used in fracture modeling showed favorable agreement with the inputs.
Noble Energy’s work in Reeves County illustrates that the original engineering methods and technologies it developed continue to enhance fracture stimulations in the Wolfcamp Shale. Its initial work demonstrated that slickwater fluid, maximizing cluster and stage spacing, and ensuring that created fractures were connected to the wellbore with adequate fracture conductivity improved well performance. The understanding of these key parameters led to field trials of larger-volume slickwater stimulations with increased proppant mass and decreased cluster spacing.
Low-viscosity slickwater can promote the opening of secondary fractures (natural fractures) and increase microseismic response, which often is interpreted as fracture complexity. Slickwater-created fractures are characterized by fracture networks with long half-lengths and small-aperture widths. A potential drawback to this diminished width is job placement issues that often necessitate lower stage concentrations and increased water volumes. Field results indicate that the wells treated with the slickwater design typically clean up faster, allowing oil breakthrough to start significantly sooner.
Initial fracture modeling results indicated slickwater treatments with longer fracture half-lengths and lower fracture conductivity would result in lower production when compared with cross-link or hybrid fluid systems with increased conductivity. Even with a modest reduction in well performance, the overall cost decrease still would support the use of slickwater designs versus more conventional fluid systems. However, field results showed increased production with slickwater, giving Noble’s team the reassurance to move forward with a slickwater fluid system as a basis of design.
Job placement issues and early stage terminations were limited, and most stages were pumped as designed with few needing unscheduled fluid sweeps to complete stages at higher proppant concentrations. It should be noted that job placement and execution efficiency are key performance indicators of operational success.
Slickwater Design
With clear economic and initial production successes, there was concern that the slickwater design would impact long-term well performance negatively because of the minimal concentration of proppant per area being placed in the fractures, and lower levels of created fracture conductivity. Larger mesh sizes and increased proppant concentrations were not considered operationally feasible because of the low viscosity of slickwater and minimal fracture width generation.
Alternatively, a design using increased proppant loading with larger fluid volumes was implemented to improve overall conductivity in the created fractures. Fracture modeling showed increased fracture area and improved conductivity with larger proppant mass and increased fluid volumes. Field results supported testing the feasibility of larger job sizes.
Tighter stage spacing with a similar number of clusters per stage was tested and the results show that an increased number of transverse fractures along the wellbore because of the increased job size corresponds with improved well performance.
DFN fracture models are excellent engineering tools to understand the fracture characteristics achieved with any given design. DFN models were used to create pre-job stimulation estimates for larger stimulation designs. An accurate model provided the opportunity to test new designs with the goal of enhancing fracture stimulation with increased proppant loading ranging from 1,800 to 5,000 pounds per foot.
Using core calibrations to improve input data–along with the ability to tie results to production history matching, RTA and APJA estimates–is providing greater confidence in the DFN results than a calibrated fracture model using only microseismic data and production history matching. It is important to utilize multiple technologies and attempt to converge results to bound solutions and calibrate the DFN model to allow for forward modeling. Matching modeled fracture results to real data is a fundamental step in gaining confidence in the DFN output. Of course, confidence in model results is largely dependent on the input data and the interpretation of the completion engineer. True engineering judgement is necessary to develop and understand the deterministic process and implement a well calibrated model.
PHM/RTA is a critical, time-consuming step in designing a fracture stimulation, but well worth the investment. Updated fracture parameters from the various fracture stimulation designs were used to forecast production uplift and economic benefits to evaluate optimal net present value and return on investment. Multiple iterations were run, varying the number of contributing clusters, thickness and fracture geometry to establish baseline results.
Analysis Results
For multistage/multicluster unconventional horizontal wells, the tactical value of this approach is an analysis of job pressures, near-wellbore pressure losses, stress shadowing effects, fracture complexity and first-principle representation of fracture geometry. APJA is a post-job engineering analysis method designed to determine the number of contributing transverse fractures (clusters) in horizontal wellbores, fracturing pressure components and the characteristic fracture half-lengths per stage.
TABLE 1
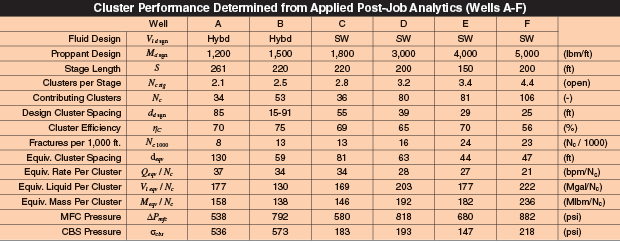
Table 1 presents the APJA cluster performance results for wells A-F, including cluster efficiency, the number of fractures per 1,000 feet, and the equivalent cluster spacing between open clusters. It is important to consider all three of these metrics. As shown in the table, mid-field fracture complexity (MFC) and complex back stress (CBS) provide insights into the degree of stress shadowing and fracture complexity generated during treatment. Higher values for each parameter indicate increased complexity and propagation of secondary and tertiary fractures.
The results indicate similar MFC values for slickwater and hybrid stimulation designs. However, there is a marked difference in CBS. This is because the hybrid completions utilized cross-linked fluid and larger grain proppant (20/40-mesh or larger) compared with the smaller-grain proppant (40/70 or finer) and slickwater-type design. The secondary and tertiary fracture apertures were created with a significantly more viscous fluid than slickwater and more pressure was generated.
Regardless of the fluid and proppants used, cluster spacing and created fracture height have proven critical design variables in obtaining high cluster efficiencies, increased transverse fractures per 1,000 feet, and equivalent cluster spacing close to the initial design. Well B was completed with an engineered perforation design and resulted in the highest cluster efficiency, but the improvement was not significant enough compared with the geometric perforation design to warrant the incremental cost.
Hydrocarbon and frac fluid tracer data from Well B also helped evaluate cluster contribution by setting the largest contribution to 1.0 in the model and then proportioning other sampling data accordingly. Since analyzing cluster contribution data is subjective, the interpretations were used primarily as a check to the APJA and RTA for contributing clusters. The tracer results on the subject well suggested a cluster efficiency of nearly 70 percent, which compared reasonably well with the APJA and RTA results for Well B (75 percent). Tracer technology also provided a minimum bound for created fracture length when the material was sampled in an offset well.
Fracture Modeling
DFN pressure matching with updated and calibrated inputs was performed for Well D, which was completed with 25 stages and 200-foot stage spacing. The surface and bottom-hole pressure match indicates that fracture height propagates well above the Wolfcamp A, extending through the Lower Third Bone Spring sand and contained by the Upper Third Bone Spring lime. Total created fracture height was estimated to be greater than 500 feet on average. This is supported by nearby microseismic data from Well A.
FIGURE 2
Stress and Concentration/Area at Closure Showing Propped Fracture Half-Length to 364 feet
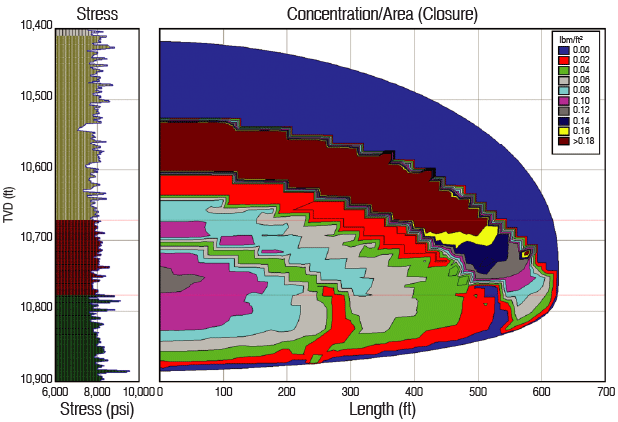
FIGURE 3
Well D Created Length, Maximum Proppant Length (Plug Displacement) and Likely Proppant Length (Settled Bank)
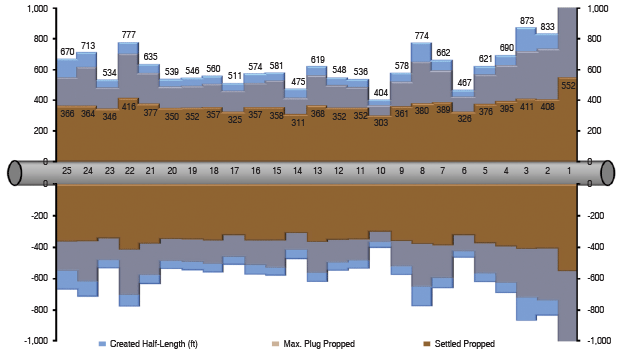
FIGURE 4
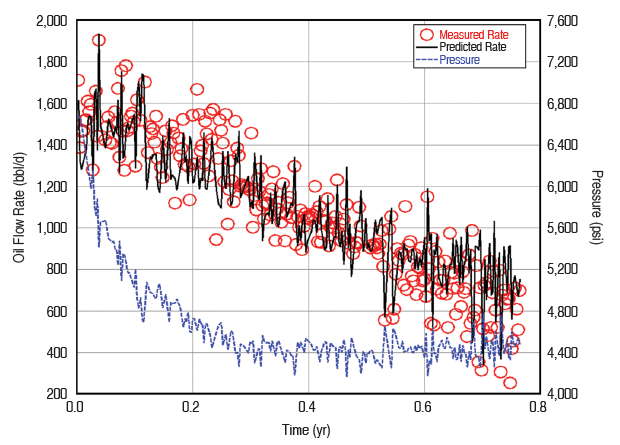
Production History Match with Bottom-Hole
Flowing Pressure (Well D)
As shown in Figure 2, the DFN pressure match resulted in average created and propped fracture half-lengths of 600-650 and 350-400 feet, respectively, which also align with microseismic data. The Upper Wolfcamp A is shown in maroon, the Lower Wolfcamp A in green, the Lower Third Bone Spring in gold and the Upper Third Bone Spring in grey.
After bounding the fracture height based on the DFN modeling, fracture influence and secondary fractures were considered. Solutions were determined for apparent net pressure, true width-opening pressure, mid-field fracture complexity, CBS, created length, maximum proppant length (plug displacement), likely proppant length (settled bank), and settled bank height. Likely proppant length can be considered propped length when compared with the DFN model and effective length when compared with the PHM and RTA. Figure 3 presents results from APJA for Well D.
Natural fracture network spacing was estimated to vary between 9 and 14 feet within the Wolfcamp A section, so 14 feet was used in the major axis direction and the designed cluster spacing was used for the minor axis spacing. This is an engineering approximation utilizing proportionality to bed thickness. Horizontal fractures explicitly were not modeled, which allowed transverse fractures to initiate and propagate only at the perforated intervals and secondary fractures to be present no less than every 14 feet. The propped length was calibrated to the PHM and RTA using a proppant concentration/area cutoff. These results were used to help calibrate APJA fracture geometry.
Production history matching was performed on wells A-F to determine effective, or propped, fracture half-lengths. Figure 4 shows a typical history match with the bottom-hole flowing pressure ranging between 4,400 and 6,800 psi. The bubble point pressure of 3,800 psi was estimated from pressure/volume/temperature analysis. Well D’s propped half-length of 350 feet was used to calibrate the effective fracture half-length in the DFN fracture.
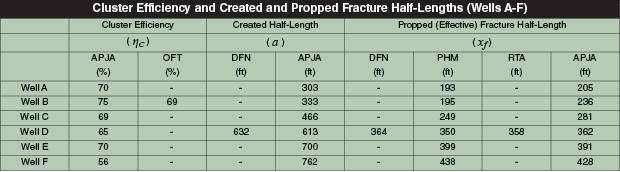
The designs with increased pound/foot loading resulted in increased propped fracture half-lengths, except for Well A, which utilized 1,200 pounds/foot and had a propped half-length of 193 feet. Well B with 1,500 pounds/foot had a propped half-length of 195 feet. The propped fracture half-lengths for the other wells were 249 feet for Well C (1,800 pounds/foot), 350 feet for Well D (3,000 pounds/foot), 399 feet for Well E (4,000 pounds/foot), and 438 feet for Well F (5,000 pounds/foot).
Rate Transient Analysis
From the probabilistic RTA analysis, permeability, number of clusters, propped fracture height and propped half-length were determined to be 386 nanodarcies, 78, 130 and 358 feet, respectively. The permeability ties well to core values, the cluster efficiency is similar to APJA and trace analysis, and the fracture geometry parameters correlate to DFN modeling, PHA and APJA.
Table 2 shows a comparison of cluster efficiency using APJA for wells A-F and hydrocarbon tracer data for Well B. Also shown are results for created fracture half-lengths from the DFN modeling for Well D and the APJA-created fracture half-lengths for Wells A-F, and a summary comparison of the effective propped fracture half-lengths from the DFN model, PHM, RTA and APJA for Well D. The remaining solutions for the A-F wells are shown from APJA only. The results from these methods converge, and the authors feel confident that the calibration and analysis techniques are useful for forward modeling and further application.
TABLE 2
Economic Evaluations
Consistent and repeatable completion methods are important, but there are some drawbacks to only considering economies of scale in field development. It is important that operators integrate technology learnings and adapt to methods that potentially cost more, but enable step changes in well performance. When proppant loading is increased, either by shortening stage length or increasing proppant concentrations per stage, a substantial increase in capital is required. In this project, the improved well performance justified the additional completion cost required to increase proppant mass and fluid volumes in the enhanced designs.
At a West Texas Intermediate oil price of $50/barrel, initial economic evaluations support the larger completions having increased ROI and NPV over the smaller jobs. Of course, variations in commodity prices and/or the cost of goods and services obviously would impact economic results, but the upper limit of improved production with increased proppant loading is still unknown.
More detailed study and field trials will be focused on optimizing stage spacing and the number of clusters throughout the acreage. This analysis becomes increasingly important when moving toward full-field development and placing numerous laterals in multiple benches. Additionally, localized proppant loading designs will be implemented, as feasible, in the Wolfcamp A, B and C intervals as well as the Lower Third Bone Spring. Finally, future work will optimize fluid volume to limit unpropped area within the hydraulic fractures and well-to-well interference.
JUSTIN E. PARKER is a well engineering lead at Noble Energy Inc., responsible for supervising a team of engineers in completing new wells. Before joining the company in 2015, he served as a completion engineer at Rosetta Resources, and a production/completion engineer at BOPCO LP. Parker holds a B.A. in business and a B.S. in petroleum engineering from Louisiana State University.
VAN P. TRAN is director of operations at Bazan Consulting Inc., focusing on hydraulic fracture design optimization, post-job well performance evaluation and organizing on-site supervision. Before joining the company in 2011, he served as an engineer at BJ Services. He holds a petroleum engineering degree from Texas A&M University.
LUCAS W. BAZAN is president of Bazan Consulting Inc., focusing on hydraulic fracture design optimization, on-site supervision and post-job well performance evaluation. Before founding the firm in 2008, he served as a completion engineer at ConocoPhillips and at BP. He holds a petroleum engineering degree from Texas A&M University and a degree in physics from Texas State University-San Marcos.
JONATHON THOMAS is a completion engineer at Noble Energy. Before joining the company in 2013, he had served at Range Resources for six years in drilling, completion and development engineering positions. Thomas holds a degree in petroleum and natural gas engineering from West Virginia University.
ARDEN RENZE is well engineering and execution manager at Noble Energy. He is accountable for all phases of completions engineering and operations in the company’s Permian Basin asset. Prior to joining the company, Renze served in various technical roles at EQT Corporation. He holds a B.S. in petroleum engineering from Marietta College and an executive M.B.A. in energy from the University of Oklahoma.
For other great articles about exploration, drilling, completions and production, subscribe to The American Oil & Gas Reporter and bookmark www.aogr.com.