


Frac Focus
Geochemical ‘Fingerprinting’ Characterizes Reservoirs In Midland Basin Study
By Douglas L. Hardman, Dave Cannon, Faye Liu, Jiang Wu and Muqing Jin
MIDLAND–The Midland Basin contains one of the world’s most prolific collections of stacked, tight reservoirs, including the Leonard, Spraberry, Dean and Wolfcamp. As operators transition to infill well “cube” development involving stacking multiple layers of wells, understanding the vertical drainage, cross-well communication and their variations through time becomes crucial in determining play economics and development strategies.
Enabled by innovative analytical and data processing technology, the oil and natural gas industry has begun to unravel the value of geochemical information extracted from produced fluid and rock cuttings to address critical reservoir development questions and identify opportunities. There are thousands of naturally occurring compounds in sampled fluids that carry a tremendous amount of information about subsurface fluid flow and reservoir dynamics. By directly monitoring and data mining the unique geochemical “fingerprints” of fluid and rock samples, invaluable reservoir characterization and performance information such as oil-in-place, reservoir quality, drainage rock volume and well communication can be quantified through time to optimize development strategies.
New methodologies and integrated workflows allow geochemical information to be captured at orders-of-magnitude higher resolution and fidelity for reservoir characterization and production monitoring applications. The technology reveals both the static (reservoir quality, oil saturation, etc.) and dynamic reservoir characteristics (fracture growth, drainage height, interwell communication, etc.) that can directly impact the entire lifecycle of unconventional reservoirs–from well stacking and spacing to completion design, reservoir management and enhanced oil recovery decisions.
Data mining the high-resolution, high-fidelity geochemical fingerprint data from a rock baseline allows a group of reservoir characterization indices (RCI) to be developed, including a reservoir quality index (RQI) and an oil-in-place index (OIPI). Different from other rock-based core analysis, RCI provides an independent dataset directly from the oil extracted from rock samples that is correlated with independent petrophysical data. Integrating the dynamic reservoir monitoring data with static RCI data helps identify well spacing, lateral landing zones and other key factors controlling unconventional well performance, and significantly improves the operator’s ability to predict performance of future development strategies.
In a Midland Basin study, the technology was used to analyze produced oil samples collected from both legacy and infill horizontal wells. Fingerprints consisting of more than 2,000 compounds resolved from each produced oil sample provided new insights into well communication through time, as well as quantitative vertical drainage variations against a vertical profile established using core/cutting samples. Specifically, RCI generated from the workflow identified similar zonal contributions in wells landed in four different intervals, revealed distinct differences in drainage geometries and overlapping drainage geometries in the four landing zones, and discerned changes in parent well drainage geometry profiles over time.
Distinctive Patterns
Recognizing the distinctive patterns of different oils is central to geochemical fingerprinting technology. Technically, all oils contain largely the same hydrocarbon compounds. The difference is in the relative abundance (pattern) of those compounds. Particularly in unconventional reservoirs, geochemical fingerprints tend to differ only in fine detail, requiring analytical data of extremely high precision and accuracy to recognize the subtle distinguishing patterns.
One of the main applications of geochemical fingerprinting in reservoir monitoring is allocating production in hydraulically fractured wells with multiple stratigraphic zones each contributing to the total oil volume. The process requires establishing a baseline (end member) for each potentially contributing formation, identifying unique geochemical fingerprints for each formation/layer, and building a numerical model based on those distinguishing patterns to calculate each source formation’s allocation.
In a conventional reservoir, the baseline is established by collecting oil samples from single-zone intervals. However, because horizontal wells drilled at relatively tight vertical and lateral spacing in stacked pays must be hydraulically stimulated, the produced oil contributions from each zone and layer penetrated by the created fractures at each stage along the lateral are commingled.
Two specific technical advancements enable geochemical fingerprinting as an unconventional reservoir monitoring tool. First is a patented physical extraction laboratory workflow that addresses fractionation between oil extracted using solvents from core and produced oil. This is particularly important in unconventional reservoirs, where the typical recovery factor is less than 10%. Solvents can extract 100% of the mobile and immobile organic matter from the rock, consequently leading to a misrepresented baseline for production allocation.
Second is improved vertical resolution to a stratigraphic interval of 10-20 feet or less using multidimensional gas chromatography (GCXGC) to provide the fine-scale pattern recognition and analysis to distinguish between the fine layers of rock in stacked unconventional reservoirs. GCXGC routinely resolves up to 3,000 compounds from whole oil samples, compared with about 100 compounds for traditional gas chromatography.
GCXGC data from cuttings and oil samples is processed using a specialized software package and three-step workflow:
- Data preprocessing, including baseline removal, noise attenuation, 3-D “blob” detection, and aligning chromatograms of all cutting and oil samples to identify common blobs;
- Data screening using duplicate samples and pattern recognition to identify unique geochemical patterns of each fine stratigraphic interval; and
- Model development and production allocation calculations, with the preprocessed geochemical data from step one used to develop the reservoir characterization indices, and results from steps two and three used for production monitoring.
Reservoir Characterization
A group of RCIs are extracted from the geochemical information data mined from the cuttings samples. As noted, the indices are designed to be a fast and independent reservoir characterization tool to delineate key properties for lateral well landing decisions and serve as the baseline for production allocation using only geochemical data of oils extracted from cuttings samples.
Despite its usefulness, the RCI method has limitations and is not intended to replace traditional core analysis. Because of how they are calculated, the indices are unitless and relative (i.e., only comparable within the same set of samples). RCI calculations also are impacted by sample size, preservation methods, age and other conditions. RCI does not provide absolute values of reservoir properties. For instance, RQI indicates the presence of higher-permeability rock, but does not provide an absolute permeability value for use in reservoir models.
There are several RCI types, including fluid mobility and water saturation, but the oil-in-place and reservoir quality indices proved particularly robust and repeatable in the Midland Basin project. OIPI is an indicator of oil saturation and represents the producible oil. RQI is an indicator of reservoir permeability. Data screening and pattern recognition generated a family of clean geochemical fingerprints collected from cutting samples to generate the baseline profile with GCXGC. Then, the profile was used to build the models and back-allocate each produced oil sample to its respective source formation.
Figure 1 shows the measured depth profiles of the RQI (left) and OIPI (right) generated from 113 cuttings samples from generic formations A-I. The OIPI indicated a significant amount of hydrocarbons in formations C and E, and from the base of formation F to upper G and H. In terms of RQI, midformation D and mid- to lower F showed the highest indications of matrix permeability. To validate the RCI results, various independent petrophysical measurements were compared and illustrated good consistency. Integrating the petrophysical data and geochemistry-derived RCI results showed agreement of log-derived permeability with RQI, as well as log-calculated oil volume and OIPI.
FIGURE 1
Reservoir Quality Index (RQI) and Oil-in-Place-Index (OIPI) Generated from Cuttings
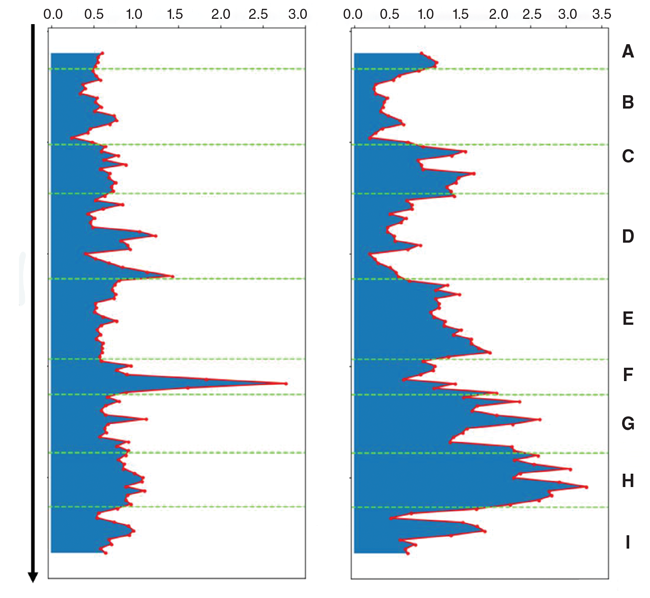
When determining the ideal landing zones, a variety of factors may come into play such as permeability, oil saturation, thickness of the pay zone, movable water saturation, “fracability,” porosity, etc. RCIs provide fast and effective information on several key parameters for this decision-making process, including permeability and oil saturation. With consideration of all the RCIs, formations E, upper G, C and H appeared to be ideal landing targets.
Analytical Results
Geochemical fingerprint data from the 113 cutting samples and 61 oil samples were loaded into the software for processing. Each chemical compound in the sample was resolved as a blob in image processing terms, or “peak” as is better known to geochemists. Because of the additional dimension of separation, each compound forms a three-dimensional blob in a GCXGC chromatogram. The blob volume corresponds to its concentration within the sample. Each blob in the chromatogram was screened using a proprietary algorithm for a combination of peak shape, peak volume and repeatability standards. Quantitative blobs that passed the screening standards were aligned and zone-specific diagnostic ratios were identified using a pattern recognition algorithm.
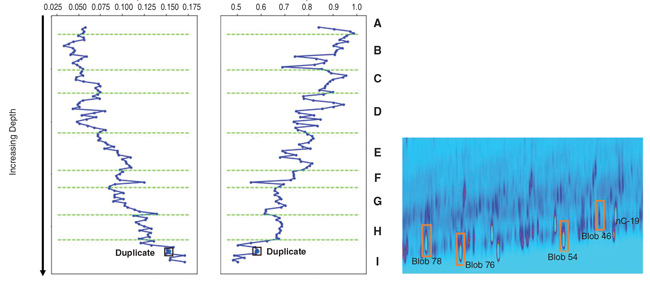
Figure 2 demonstrates that clear geochemical distinctions were observed among each of the formations across the 2,240-foot interval. Hundreds of geochemical profiles were established for each of the formations from cutting and oil samples. These profiles served as the baseline for the production allocation work that followed. The black box denotes duplicate analysis ran for the 10,240-foot sample to demonstrate the significance of the vertical geochemical differences observed among the formations.
FIGURE 2
Vertical Geochemical Profiles Showing Variations by Formations (Blobs 46/54 and 76/78)
Produced oil samples from the horizontal wells were collected at the wellhead and shipped to the lab for GCXGC measurement. The collected geochemical fingerprint information from produced oils was processed and aligned with the cutting baseline samples. More than 2,000 compounds were found in the oil samples in various categories, including alkanes, alkenes, cycloalkanes, alkyl-benzenes, aromatic and saturated biomarkers. The crude oils are composed of those naturally occurring compounds that can be used as natural tracers providing hints to reveal subsurface reservoir performance.
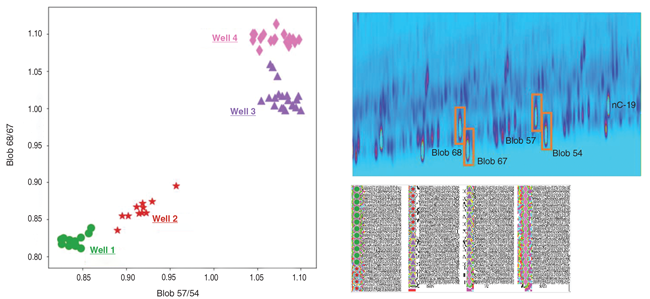
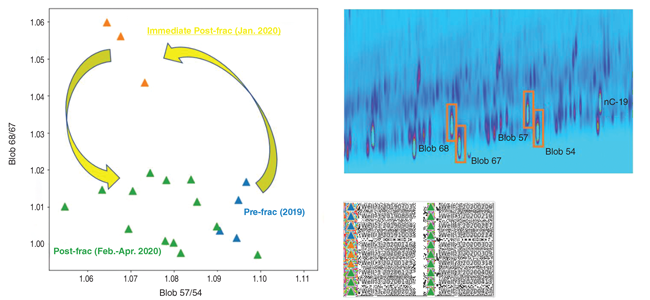
Figure 3 is a geochemical ratio cross-plot of produced oil samples clustered by wells. The GCXGC chromatogram of the illustrated blobs is at upper right. The results indicated the four wells were draining from different reservoir rock volumes or vertical zones, although there was some overlapping that caused higher similarity between wells 1 and 2 versus wells 3 and 4. Many compounds have been identified, and the diagnostic ratio it shows is not unique, in that it is one of hundreds of geochemical ratios that effectively distinguishes oils from different wells/formations. The robustness of the geochemical information was reflected by the fact that the clustering was observed in all the oil samples collected for nine months.
FIGURE 3
Geochemical Ratio Cross-Plot of Produced Oil Samples Clustered by Well
Production Allocation
There were noticeable geochemical signature changes in oils collected at different times from the same well. Correlating these geochemical variations in the oil samples to the baseline cuttings samples quantitatively using a regression model revealed how the contribution from each formation changed through time, leading to observed geochemical variations.
Quantitative production allocation showed that Well 1’s drainage was largely bounded within formation C (90%) in the first three months of production. The frac did appear to grow into the upper zone (formation C) and the lower zone (formations D and E). However, formation C’s contribution was negligible (<2%), while drainage from the lower zones appeared to increase slightly through time from an initial combined contribution of 5% in January 2020 to 10% in April.
Significant cross-drainage was observed in Well 2. Despite being landed in Formation D, the main contributor in Well 2 was the same as Well 1: Formation S2. Contribution from Formation C averaged ~60% in the first three months of production. Contribution from Formation D in Well 2 steadily decreased from an initial ~43% on the first sample collected in January to ~25% four months later in April. The higher initial productivity of Formation D may relate to its higher permeability, which was reflected by the RQI. However, total in situ hydrocarbons may be limited in the zone as reflected by the OIPI, which may be the limiting factor for its long-term productivity.
Fractures of Well 2 did appear to reach downward into Formation E, which could be a result of both Well 2 fractures propagating downward and fractures from wells landed in Formation E propagating upward. However, the contribution of Formation E in Well 2 remained less than 8% and showed a declining trend through time.
Parent wells 3 and 4 had both been on production for more than a year when the first oil samples were collected in July 2019 in advance of adjacent infill drilling activities. In Well 3, Formation E’s contribution averaged 75%, with another 10% from lower Formation F and 15% from the G on average. As illustrated in Figure 4, Well 3 (orange) showed strong downward growth and its drainage partially overlapped with Well 4 (purple).
FIGURE 4
Fitted Production Allocation Curves Plotted on Gun Barrel Section Oil Samples from Each Well
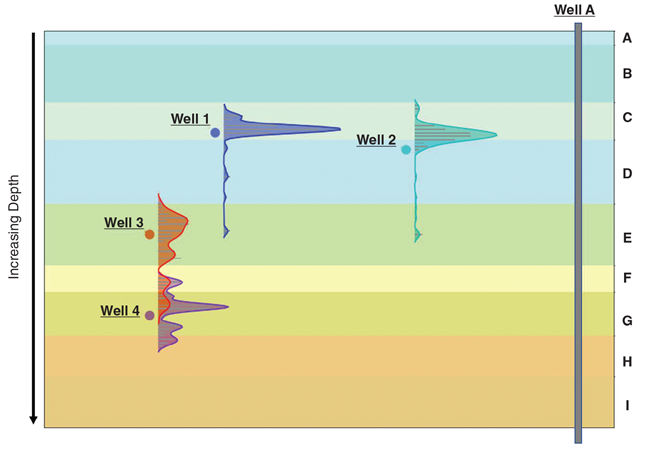
In Well 4, the pre-frac samples consistently showed a 3-4% contribution from the upper zone of formation E, indicating upward frac growth. However, this contribution disappeared in all post-frac samples. Well 4 saw balanced upward and downward frac growth with 10-15% from upper Formation F, 10-15% from lower Formation H and the rest from G, its landing formation.
Drainage Frac Height
Figure 4 shows a convenient way to visualize the drainage of each well and changes through time as revealed by production allocation results, as well as cross-drainage between stacked wells using a fitted curve generated from production allocation results of contribution intensity (contribution from each baseline cutting sample) and density (how many adjacent baseline cutting samples contribute).
From the vertical drainage, wells 1 and 2 demonstrate a more “contained” fracture geometry with key drainage frac height (consistently covering 90% production) at 180 and 240 feet, respectively. Drainage frac heights are noticeably larger in wells 3 and 4 at 540 and 380 feet, respectively. Wells 1 and 2 saw a strong upward drainage frac growth with limited downward drainage. Well 3 has stronger downward drainage frac growth than upward, but not as unbalanced as in wells 1 and 2. Well 4 had well-balanced drainage both upward and downward. The RCI showed significant resource in Formation H, which did not appear to be effectively drained by the wells landed in Formation G, as demonstrated in Well 4.
Drainage frac height revealed by oil sample-based production allocation is the result of many factors. Matrix permeability, oil saturation and other reservoir properties typically serve as a first-order control, with completion job size superimposed as a second-order control. Other dynamic factors such as adjacent operational events of nearby well shut-ins, frac jobs and pressure communication also often play a role. Therefore, the stimulated frac height monitored by microseismic or fiber optics is a prerequisite condition for drainage, although stimulated rock may not necessarily contribute to production because of these other factors.
Produced oil samples from wells 3 and 4 were collected monthly for four months before starting offset infill drilling to establish the two parent wells’ baselines. The pre-frac samples from Well 3 are represented in blue markers in Figure 5. Immediately after the infill drilling and completion jobs, the parent wells were brought back on line and oil samples were collected within the first month as presented by the orange markers. There were noticeable changes in geochemical signatures in the pre-frac versus immediate post-frac produced oil samples from both parent wells, illustrating hits from the infill well frac treatments.
However, after approximately four months, the geochemical signatures returned to patterns similar to pre-frac, as illustrated by the green markers in Figure 5. When corelating with the production allocation results, the zonal contribution impact of the frac hit to parent wells 3 and 4 was within 10% during the initial four months of fracturing the infill wells.
FIGURE 5
Produced Oil Sample Geochemical Fingerprints Before and After Infill Drilling (Well 3)
The results of the Midland Basin application demonstrate how high-resolution geochemical fingerprinting technology provides quantitative, actionable information related to reserves, reservoir characterization and reservoir performance to optimize the economic development of shale reservoirs. The workflow also has been applied in many other major unconventional basins in both North and South America, including the Delaware, Eagle Ford, Williston, Anadarko, Powder River, Denver-Julesburg, Montney, and Vaca Muerta.
Editor’s Note: For more information on the workflows and findings of the Midland Basin project, see URTeC: 2902, "From Reservoir Characterization to Reservoir Monitoring: An Integrated Workflow to Optimize Field Development Using Geochemical Fingerprinting Technology,” a technical paper prepared for presentation at the 2020 Unconventional Resources Technology Conference.
DOUGLAS L. HARDMAN is senior petrophysicist at Diamondback Energy in Midland. He joined the company in 2019 after several years as an exploration petrophysicist in the Middle East with Saudi Aramco and Baker Hughes, in North Africa with Apache, and in North America with Petro-Canada and Schlumberger. Hardman holds a bachelor’s in engineering from Lakehead University.
DAVE CANNON is senior vice president, geoscience and technology, at Diamondback Energy. He joined the company as a senior geologist in 2014 after serving in exploration and geology roles at Newfield Exploration, Samson Resources and ConocoPhillips. Cannon holds a B.S. in geology from SUNY Brockport and an M.S. on structural geology from Pennsylvania State University.
FAYE LIU is founder and chief executive officer of Houston-based RevoChem LLC, which provides geochemical fingerprinting solutions for field development. She also serves as a professor of practice at Texas A&M University. Before founding RevoChem in 2018, she was a geochemist and geologist at ConocoPhillips. Liu holds a B.S in environmental and civil engineering from Hohai University, and an M.S. in geochemistry and a Ph.D. in geological and earth sciences/geosciences from Indiana University Bloomington.
JIANG WU is co-founder and vice president of analytical technology at RevoChem LLC. He was a post-doctoral research fellow at the University of Texas Health Science Center before co-founding the company. Wu holds a B.S. and an M.S. in microbiology from Wuhan University, and a Ph.D. in biochemistry from Indiana University Bloomington.
MUQING JIN is a data scientist at RevoChem. He joined the company in 2019 after interning with RevoChem in 2018. Jin holds a Ph.D. in geophysics and bachelor’s degrees in physics from the University of Houston and the University of Science & Technology of China.
For other great articles about exploration, drilling, completions and production, subscribe to The American Oil & Gas Reporter and bookmark www.aogr.com.