


Reservoir Optimization & Modeling
Geostatistical Inversion Guides Development In Complex Formations
By Haihong Wang, Kevin Chesser, Jeff Zawila, Samuel Fluckiger, Gary Hughes, Preston Kerr, Andrew Hennes, Howard J. Titchmarsh and Michael Hofmann
DENVER–The economics of unconventional plays can be improved by placing horizontal wellbores to target facies with the most favorable reservoir and geomechanical properties. Recognizing that, an integrated multidisciplinary approach was developed to reduce economic risk, facilitate improved and faster decision making, and enable more efficient and effective well placement in a tight, stratigraphically complex Upper Cretaceous Sandstone in the Powder River Basin.
The subsurface environment was known to exhibit significant variations in lithofacies and reservoir properties, both laterally and vertically. The objective was to provide an accurate and synergized understanding of interwell reservoir characteristics, quantitatively honoring all input geoscience data and verifying through blind well testing. That goal was achieved by utilizing geostatistical inversion to predict lithofacies and reservoir rock/geomechanical properties that honored data from multiple disciplines.
The results of the seismically-constrained geomodeling work include lithological and reservoir property maps, as well as associated uncertainty measurements for selected facies and properties. This approach is enabling optimal identification of sweet spots for reservoir development and well placement in the unconventional formation, and demonstrates the value of incorporating stratigraphic, geological, petrophysical, engineering and geophysical data into an integrated subsurface reservoir model.
At the current stage of reservoir science, abundant information is available from multiple disciplines. Well information, including wireline logs, core and production data, have demonstrated their value and have contributed greatly to understanding conditions at the borehole in terms of geological, reservoir and engineering properties.
While analyzing these data provides a global context to understanding the big picture of the reservoir, dense 3-D seismic datasets provide a wealth of both quantitative and qualitative subsurface information away from wells, in the form of “elastic properties” that relate directly to observations at the wellbore.
These elastic properties consist of critical calibration information extracted from 3-D seismic data, namely compressional (P) velocity, shear (S) velocity, and density. These seismic data link directly to the same elastic properties obtained from wireline data measured in the well bore. These two independent measurements of elastic properties, derived from different primary sources, calibrate with each other to establish relationships between lithofacies and reservoir rock properties.
Essentially, elastic properties bridge the well-centric world with the seismic-centric world to significantly increase the understanding of the subsurface so that more intelligent decisions can be made. As the Powder River Basin project demonstrates, 3-D seismic data can be transformed into a far more valuable and superior calibrated petrophysical subsurface volume, which then can be blind-tested against known well data.
Technical Background
Observations from various geoscience disciplines provide value in their own right because of their unique perspectives. However, unless all data are integrated to provide a valuable common solution, each type of data, when analyzed and interpreted independently, may lead to different conclusions. As a result of each discipline potentially being “blind” to the contributions of the others, an accurate mathematical tool is required to combine various sources of prior geoscience information in an unbiased and consistent manner to achieve an improved subsurface understanding.
Bayes’ theorem is a statistical tool used to manipulate conditional probabilities. Mathematically, Bayes’ theorem defines the relative weight given to prior information from different disciplines. Accordingly, data from geology, well logs, seismic and reservoir engineering can be honored quantitatively without bias and in a way that converges into one solution space. Using Bayes’ theorem, geostatistical inversion provides a robust method to effectively characterize a reservoir into discrete facies/properties that exhibit a range of production capacities to allow more effective well placement.
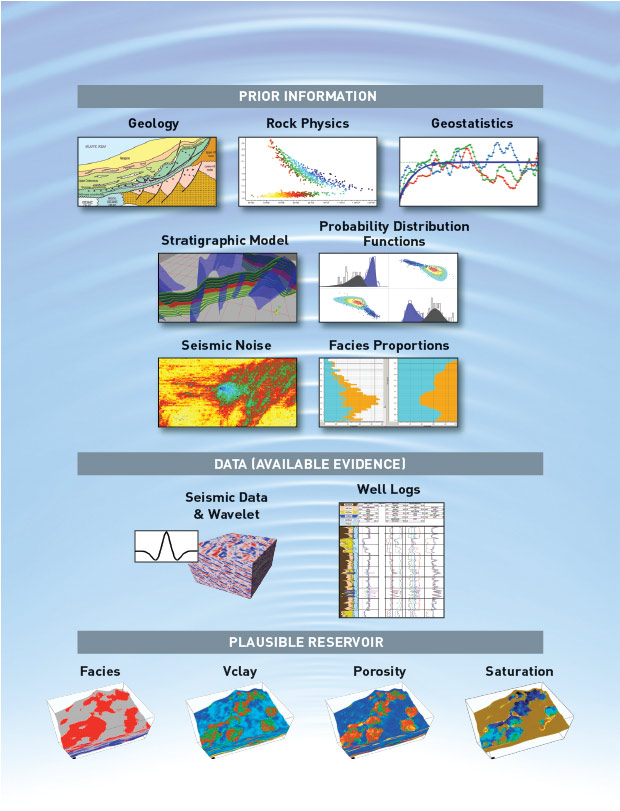
The geostatistical inversion workflow starts with prior information on the reservoir, which typically includes some knowledge of local geology, rock physics information describing the various rock types, and geophysical and engineering properties.
Geostatistical information is provided from well data analyses and interpretations of the geological environment, including a stratigraphic model that defines horizons and faults interpreted from 3-D seismic data and deterministic inversion results. Probability distribution functions (PDFs) are a key element in the workflow. PDFs describe the range of values expected for lithofacies, elastic properties, seismic noise levels, and relative lithofacies proportions.
FIGURE 1
Log Facies and Seismic Facies (Well A)
Integrated Petrophysics Model
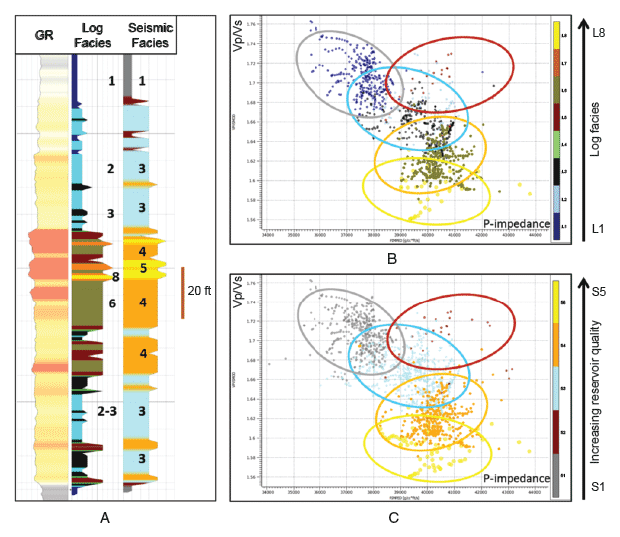
A three-phased approach was employed in the Powder River Basin study. The first phase required petrophysics and rock physics modeling of wireline logs calibrated to core data. The core facies were upscaled and tied to the wireline log facies, and the log facies were upscaled and tied to the seismic facies. Modeling the tight sandstone from well log data yielded five unique lithology types discriminated by the seismic elastic response.
Figure 1A illustrates the log facies relative to the seismic facies for well A. Figure 1B shows the log-derived elastic properties (the same that may be derived from 3-D seismic data) colored by eight log facies on the Z-axis. The eight log facies are identifiable based on all available wireline and core data (gamma ray, neutron porosity, resistivity, etc.).
Figure 1C shows P-impedance versus the P and S velocity ratio (Vp/Vs) colored by five seismic facies on the Z-axis. Because only five lithofacies were separated adequately in elastic space (P-impedance versus Vp/Vs), the original eight lithofacies were reduced to five by merging certain lithofacies that had a great deal of overlap in elastic space. This yielded a more meaningful result, and facilitated a more accurate discrimination of realistically identifiable lithofacies within the 3-D seismic volume that also were observable in core and log data.
Refined Earth Model
The second phase of the study involved detailed reinterpretation of the horizons performed on layer-based simultaneous inversion data to remove false artifacts produced by wavelet and tuning effects. As shown in Figure 2, P-impedance is a good indicator of the top and base of the Upper Cretaceous sands. Vp/Vs provides additional information, which assists in delineating the base of the Upper Cretaceous sands. This approach generates a refined stratigraphic earth model, and was developed exclusively for use in geostatistical inversion.
FIGURE 2
Band-Pass P-Impedance And
Deterministic Inversion Results
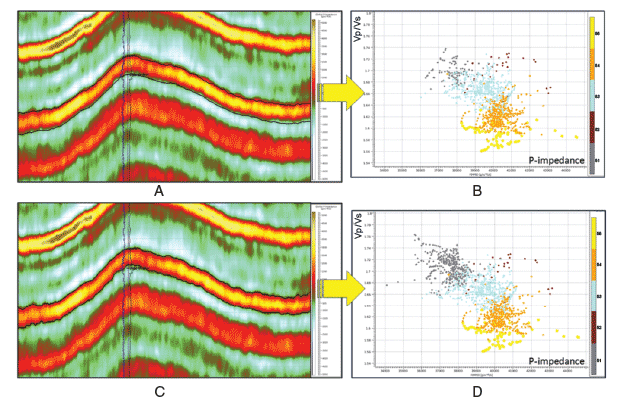
Based on the reinterpreted stratigraphic earth model, probability distributions of each seismic facies were determined accurately in P-impedance, Vp/Vs ratio, and density probability distribution space, as illustrated by the difference in the lithofacies distribution in Figure 2D.
Figure 2A shows the original horizons overlaid on the band-pass P-impedance. Yellow represents high P-impedance, blue is gamma ray, and black is resistivity at the well location. All of the reflectivity features are preserved from the seismic and the data are seen with far superior clarity. Figure 2B is a cross-plot of P-impedance versus Vp/Vs colored by lithofacies, showing the original interpreted Upper Cretaceous Sand.
Figure 2C displays the reinterpreted horizons overlaid on the band-pass P-impedance, with the horizons matching the well tops and elastic property contrasts. The P-impedance versus Vp/Vs colored by lithofacies cross-plot in Figure 2D shows a more representative identification of lithofacies, in terms of elastic properties, derived from the now accurate interpretation of the Upper Cretaceous Sand.
While the difference between the cross-plots in Figures 2B and 2D may appear small (it is most noticeable in seismic facies S1 shown in gray), it is important that the facies are represented accurately within the interpretation of the horizons because these bounding surfaces control which cross-plot facies statistics are used to derive the PDFs, which in turn, drive the geostatistical inversion. The seismic facies S1 is the seal for the Upper Cretaceous reservoir.
Seismically Constrained Process
The third phase involved the simultaneous geostatistical inversion of the seismic 3-D partial stacks. This phase incorporated data from various disciplines, including the deterministic inversion, to provide highly detailed subsurface facies models along with absolute reservoir rock and geomechanical properties. Associated uncertainty measurements for all properties were calculated from the 21 realizations produced by the seismically constrained geomodeling process, and each property honored all prior input information provided from well logs, core data, geology, seismic data, and geostatistical information.
Summary volumes of P-impedance, Vp/Vs, density, Young’s modulus and Poisson’s ratio, as well as probability volumes for porosity, individual and most probable lithofacies, were generated. These volumes were tested against blind wells and subsequently used for interpretation and well planning.
Figure 3 displays a cross-section flattened to the top of the Upper Cretaceous Sand horizon. It compares the level of detail seen in the well logs with the original seismic dataset, and shows results from deterministic inversion along with results from geostatistical inversion. Figure 3A shows the lateral variability of the well lithofacies (overlaid on seismic), and how limited seismic resolution was over the target zone.
FIGURE 3
Cross-Section Flattened to Top of
Upper Cretaceous Sand Horizon
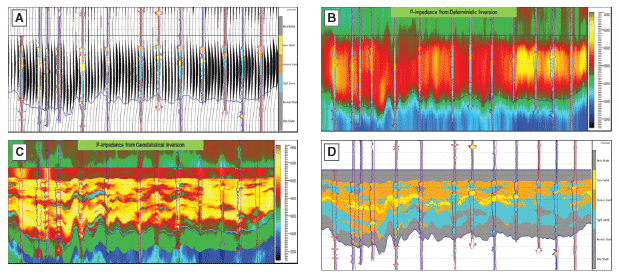
Figure 3B shows the well lithofacies overlaid on the P-impedance derived from deterministic inversion. P-impedance is smeared, showing only relative lateral and vertical interwell changes for the tight sands, which are represented by high P-impedance and are displayed in yellow. It is evident that vertical resolution still is limited.
Figure 3C shows filtered well P-impedance logs overlaid on the P-impedance derived from geostatistical inversion, while Figure 3D shows the well log lithofacies overlaid on the lithofacies volume derived from geostatistical inversion. The characterization of the reservoir produced by geostatistical inversion provided a highly detailed, seismically constrained and accurate subsurface model calibrated to well control.
The well data correlated well with the seismically derived subsurface geomodel for both lithofacies and associated reservoir properties, and the results provided a reliable indicator of interwell subsurface reservoir conditions.
Again, the subsurface model honored all well data, including wells subsequently used as blind tests, verifying the value of the model as an accurate and predictive tool for reservoir development and well planning.
Stratal slices and cross-section views of the five lithofacies (seismic facies) were generated from the geostatistical inversion results. The cross-sections and stratal slices describe the variability of the heterogeneous reservoir and appear geological in nature. The analysis showed that reservoir quality increases from seismic facies S1 to S5, with the S4 and S5 facies as the pay reservoirs.
In addition, effective porosity was generated by geostatistical simulation using the inversion outputs as secondary trends (co-simulation). The 3-D elastic property and lithologic volumes produced highly detailed 3-D models of effective porosity, exploiting the relationships between the reservoir and elastic properties.
FIGURE 4
S5 Geobody in 3-D Reservoir View
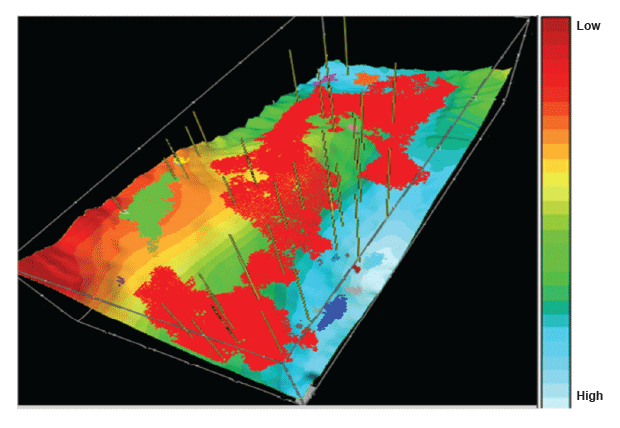
FIGURE 5
Thickness Maps Overlaid with Structure Contours (Top of Upper Cretaceous Sand/Seismic Facies S4 and S5)
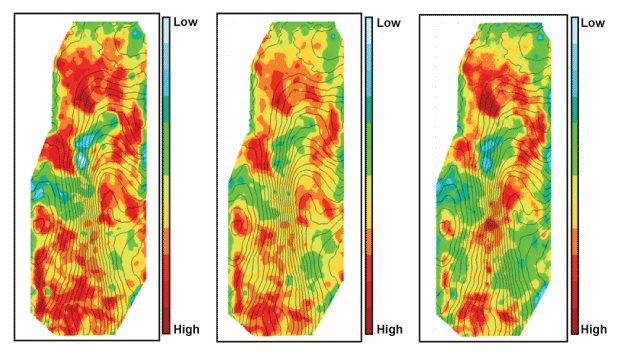
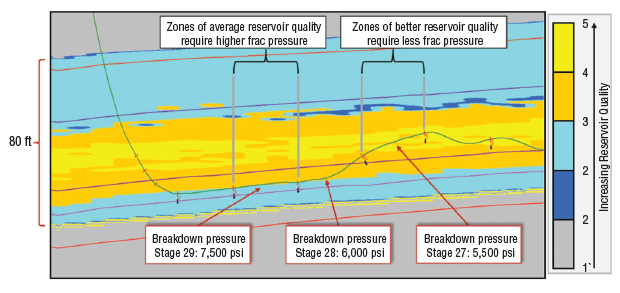
FIGURE 6
Lithofacies Volume from Geostatistical Inversion
And Well Treatment Plots
Reservoir Characterization
A series of highly detailed lithologic and elastic rock property 3-D volumes were created through a Markov chain Monte Carlo and Bayesian inference method to systematically incorporate various sources of prior information in an unbiased, rigorous and consistent manner. The final synergized datasets accurately characterized the 3-D reservoir distribution as tested against blind wells.
The 3-D reservoir geobody in Figure 4 shows lithofacies S5 (displayed in red) for the Upper Cretaceous Sand where the probability of encountering the S5 facies type is between 50 and 100 percent. The percentage probability cutoff can be investigated easily by changing the cutoff.
The three panels in Figure 5 display thickness maps overlaid with structure contours for the top Upper Cretaceous Sand (seismic facies S4 and S5), including from left to right, gross thickness, probability thickness and porosity-thickness (Phi-H).
A horizontal well penetration relative to the seismic-derived lithofacies with associated treating pressures applied during hydraulic stimulation demonstrates how the results are being used to efficiently plan well penetrations to maximize production in these heterogeneous reservoir lithofacies.
As shown in Figure 6, lower fracturing pressures are encountered in the higher-quality reservoir lithofacies (orange and yellow). Not only do these lithofacies produce better, but they require less pressure to effectively stimulate the reservoir. Increased efficiency, reduced drilling risk, and more informed and faster decisions are enabled while engineering, planning, drilling and completing wells.
By using geostatistical inversion to quantitatively and synergistically integrate geoscience data from various disciplines, a reliable, seismically constrained subsurface model was generated that complemented traditional well-centric geomodels and provided a clearer and more geologically realistic image of the interwell subsurface to identify reservoir sweet spots.
Three-dimensional models of the five important lithofacies were produced, along with petrophysical and geomechanical property models that incorporated all the characteristics of the reservoir as understood from well data. The true structural shape, architecture and thickness of formation lithofacies were imaged successfully, in addition to effective porosity.
The results of this approach can be used by engineers, geophysicists, geologists and geomodelers to properly predict production and reserves, and to efficiently maximize well placement within an asset by planning, drilling and completing wells in the most efficient manner based on precise petrophysical volumes and maps.
An improved stratigraphic and structural interpretation of the horizon also was achieved. The integrated multidisciplinary study gave the operator uncertainty measurements for probability analysis of the lithofacies or reservoir properties, and enabled prospective drilling/development areas to be ranked.
HAIHONG WANG is a principal geophysicist at CGG GeoConsulting. She began her career in 1995 as a petrophysicist at Sinopec China, and then worked for the company as a geophysicist and geomodeler for seven years. In 2006, Wang joined the ESSCA Group, representing Schlumberger in China as a geomodeling software product technical manager, serving in that capacity until she began her assignment at CGG GeoConsulting in 2010. She holds a B.A. in geophysics and an M.S. in applied mathematics from Northeast Petroleum University.
KEVIN CHESSER is chief petrophysicist of seismic reservoir characterization at CGG GeoConsulting in Houston. He has more than 30 years of experience in exploration and development geology, petrophysics, and seismic reservoir characterization. Since joining CGG in 2008, Chesser has worked in a number of conventional plays as well as unconventional plays, including the Barnett, Haynesville, Marcellus, Bakken and Eagle Ford. He holds a B.S. in geology from Sul Ross State University and an M.S. in geology from the University of Kansas.
JEFF ZAWILA is a senior geophysicist at SM Energy Company. He began his career in 1997 as an exploration geophysicist at ARCO Alaska, and then with ConocoPhillips Alaska. Zawila joined EOG Resources as a senior geophysicist in 2002, serving in that capacity until beginning in his assignment at SM Energy in 2011. He holds a B.S. in geology and geophysics from the University of Missouri-Rolla, and an M.S. in geophysics from the University of California, Riverside.
SAMUEL FLUCKIGER is a senior petrophysicist at SM Energy, concentrating on the Powder River, Williston and other basins in the Rocky Mountain region. Before joining SM Energy in 2012, he worked for 12 years as a petrophysicist and wireline field engineer at Schlumberger. Fluckiger holds a B.S. in geology from Utah State University and an M.S. in geophysics from the University of Utah.
GARY HUGHES is a senior geologist at SM Energy. He joined the company in 2010 after a 30-year career that included 14 years of service as an exploration geologist at Texaco, six years as a senior geologist at North American Resources Company, and 10 years as an independent consultant at Hughes Exploration Inc. Hughes holds a B.A. in geology from Augustana College and an M.S. in geology from Montana State University-Bozeman.
PRESTON KERR is a geologist at SM Energy, focused on developing Cretaceous units in the Powder River Basin. Before joining the company in 2013, he was a geology intern for Marathon Oil Corp.’s Bakken asset team, and operations coordinator, geologist, for Richardson Operating Company. Kerr holds a B.S. in geology from the University of Colorado and an M.S. in structural and petroleum geology from the University of Oklahoma.
ANDREW HENNES is exploration manager of the Rockies region at SM Energy. He joined the company in 2006 as a senior geologist after beginning his career as geophysical field manager at Echotech Geophysical, and then as a geologist at Chevron. Hennes holds a B.S. in geology from the University of Montana and an M.S. in geoscience from the University of Arizona.
HOWARD J. TITCHMARSH formerly served as senior business development manager at CGG GeoConsulting. Now located in the United Kingdom, he is managing a property portfolio and seeking opportunities within the oil and gas sector. Titchmarsh joined Fugro-Jason (subsequently acquired by CGG) in 2004. Prior to that, he worked at Paradigm Geophysical, Landmark Graphics, and Terrasciences Inc. Titchmarsh holds a B.S. in geology from Royal School of Mines and an M.S. in petroleum geology from the University of Aberdeen.
MICHAEL HOFMANN is founder, principal and chief executive officer of AIM GeoAnalytics and a research assistant professor in the department of geosciences at the University of Montana. With technical expertise in sequence stratigraphy, sedimentology, petrography and integrated basin analysis, he has worked in basins across North America and around the world. Hofmann previously served as a senior geologist at ConocoPhillips. He holds a Ph.D. in geology from the University of Montana.
For other great articles about exploration, drilling, completions and production, subscribe to The American Oil & Gas Reporter and bookmark www.aogr.com.