


Seismic & Geophysics
High-Density, Long-Offset 3-D Datasets Drive Seismic Acquisition
By Kari Johnson, Special Correspondent
Onshore unconventional formations and deepwater subsalt horizons present radically different operating settings and technical challenges, but the role of petroleum geophysics remains essentially the same in both environments: getting to the “ground truth” to determine where (and where not) to place wellbores.
After all, the need to accurately describe the subsurface, reduce risk and predict geologic properties between wellbores is the same whether those wells are separated by a matter of hundreds of feet on the same horizontal well pad in West Texas or by several miles in adjacent offshore fields in Walker Ridge, driving a common need for more dense, wider-azimuth, longer-offset, higher-resolution images.
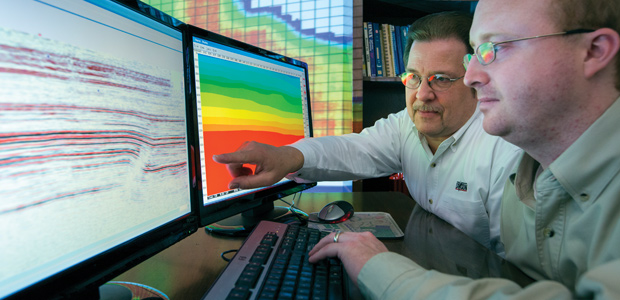
“For many years, the seismic method was an exploration tool. It indicated where to drill based on structural components or structural representations of trapping and sealing mechanisms,” says Steve Jumper, chief executive officer of Dawson Geophysical Company. “In general, with unconventional plays, the use of geophysics expanded into complex reservoir characterization and development-type applications.”
Seismic data was used early on in unconventional applications more for identifying hazardous structural components such as faults, folds, karsting and dip directions, Jumper explains. “By utilizing more attribute-rich seismic data, the science is moving toward having the ability to identify the most favorable rock for completions,” he says.
Consequently, seismic data is helping operators figure out not only where to drill to access the most “fraccable” rock, but also how to drill with respect to selecting the best landing zone and planning the well path on optimal spacing, Jumper goes on. “Acquiring high-resolution 3-D data with higher density and wider azimuth also allows seismic data and attribute analysis to be a better predictor of stratigraphy,” he adds, noting that rock make up is particularly critical in stacked resource plays with multiple prospective pay zones.
“We have enough seismic data and well control in the Permian Basin, in particular, to have a pretty good idea of the structural complexity, but we do not know with nearly as much degree of certainty what the stratigraphic components look like,” explains Jumper. “As we increase density and apply analytics, there is a better chance of using seismic data as a predictor for rock stress, rock type, and rock fabric for better placement of a horizontal well in the sweet spot of an unconventional reservoir.”
High-Resolution 3-D Data
Dawson recently completed an acquisition project in West Texas with a peak of 48,000 channels. This was the largest project in the company’s history, Jumper reports, representing a 15-fold increase in density, volume and data source points acquired per day compared with typical projects. “Combined with another survey project in eastern New Mexico with 34,000 channels, the total field recorded data was 1.4 petabytes, yielding about 157 terabytes of high-density, high-resolution 3-D seismic data,” he reports.
Identifying topographical and geographical surface hazards is so critical to the success of seismic data acquisition projects that Dawson Geophysical maintains a subsidiary, EagleEye Geospatial, to address these issues through high-resolution aerial imaging. Both manned and unmanned aircraft platforms capture detailed images to map roads, fences, power lines, production sites, pipelines and other surface features before boots ever hit the ground.
And those surveys could be preludes to an even higher-channel count project in Dawson’s near future, according to Jumper, who notes that the company currently is shooting a multicomponent project in the Midland Basin that requires as many as 44,000 three-component units or 132,000 channels.
“Shooting 500 square miles in West Texas looks a lot different than 500 square miles in the SCOOP/STACK play in Oklahoma, where there are many smaller land and mineral owners,” Jumper states. “Timing becomes an issue as to when projects are ready from a permitting standpoint.”
Channel count is also on the rise in land surveys in Canada, where Dawson Geophysical has been recording multicomponent data that capture compressional as well as shear energy to image vertical and horizontal seismic waves in three dimensions. “We are building views into our 3-D surveys that lend themselves to better imaging analysis,” Jumper remarks. “We design surveys to illuminate subsurface points in as many directions and distances from shot to receiver as possible.”
Because Canadian structures tend to be much shallower, the multicomponent 3-D surveys are generally not as big from an areal coverage standpoint as in the lower-48, but have much higher source and channel densities. “It is not uncommon to have 10-meter spacing, and channel count tend to be driven more by density in Canada than in the Permian Basin,” he explains. “The density allows us to illuminate shallow objectives very well.”
Multicomponent Project
The company recently completed a high-density 3-D multicomponent project with 96,000 channels. More than 60 terabytes of output high-density, high-resolution data was generated from about 1.6 petabytes of field recorded data, according to Jumper.
Areal extent and density are the two key drivers of increasing channel counts, Jumper says. “It is common to have surveys that are hundreds of square miles, and we have had some that are in the thousands of square miles, where it is taking multiple crews to get the project done in a timely manner,” he details, adding that both the density of energy source placement and respective channels within a given area are increasing.
Energy source placement and movement become important in efficiently completing the surveys without source interference. “Let’s say we are 25,000 feet apart in the Permian Basin, or roughly five miles in any direction from the energy source,” he posits. “We would need to have basically 100 square miles of channels on the ground.”
The energy source would illuminate 2.5 miles outward in all directions, or about 25 square miles. That shot point will move a few hundred feet or so and shoot again. This continues over the entire survey, moving a very large template at very small increments. “Each point has many illuminations, building redundancy for statistical analysis,” Jumper explains.
Of course, there are also various techniques for implementing energy sources in an almost simultaneous manner, which is facilitated by the size of the survey. Sometimes a survey is large enough that multiple sets of energy sources can operate almost simultaneously, he says.
Aerial Imaging
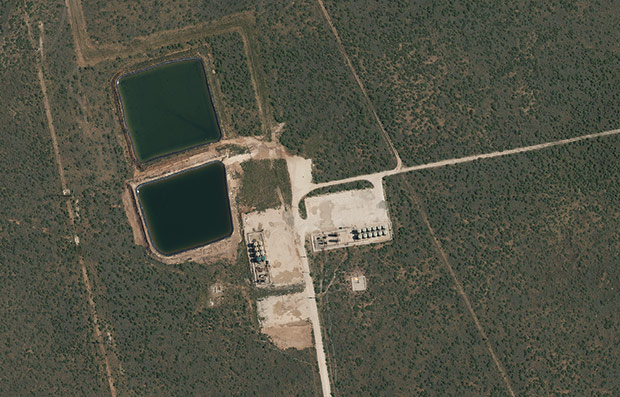
In onshore data acquisition, the single biggest challenge to survey design is arguably not what lies beneath the surface, but what is on top of it–be it in an urbanized area or a rural area with complex terrain. Identifying topographical and geographical hazards on the ground is so critical to acquisition success that Dawson maintains a subsidiary, EagleEye Geospatial, to specifically address these issues with aerial imaging services, Jumper says.
“The typical approach for well pad planning is to pull up an image on Google Earth, but in sparsely populated areas those images could be more than two years old,” Jason Stockstill, general manager of EagleEye, points out. “As fast as changes happen in areas like the Permian Basin, the imagery needs to be much more current.”
In addition to up-to-date information, aerial imaging provides very high resolution and accurate elevation information. “We have the necessary resources, from our UAV to manned aircraft platforms, to capture details with an accuracy of less than one foot,” says Stockstill. “We can map roads, fences, power lines and other features and plan around them long before boots ever hit the ground to help improve the timing and efficiency of Dawson’s field crews.
“EagleEye utilizes these resources to support the activity of our seismic crews and to provide a means for improved efficiencies through the collection of accurate imagery and the distribution of multiple layers of geospatial analysis that has proven to be useful to our clients within the oil and gas industry,” Stockstill adds.
Deepwater Gulf of Mexico
In the Mississippi Canyon area in the Gulf of Mexico, CGG has acquired a new high-density multiclient nodal survey designed for high-quality imaging of the subsurface and improved definition of subsalt structures.
“We are seeing that clients want increased density for enhanced resolution of target reservoirs,” says Matt Bognar, CGG’s senior vice president of multiclient and new ventures for the Western Hemisphere. “The idea is to get a better image from a better velocity model that leads to a better interpretation with less uncertainty.”
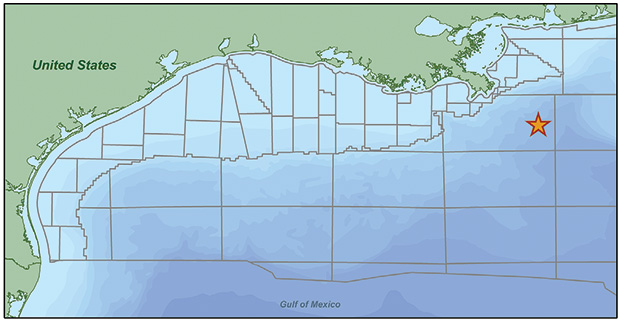
CGG has completed the acquisition of a multiclient ocean-bottom nodal survey in the Gulf of Mexico’s Mississippi Canyon area. The overall permit area for acquiring the high-density, full-azimuth and long-offset data is almost 1,900 square kilometers. Using advanced full-waveform inversion and proprietary velocity modeling algorithms, the survey is designed for high-quality subsurface imaging and improved definition of subsalt structures.
Innovative ocean-bottom node (OBN) acquisition methods and CGG’s unique velocity modeling algorithms, powered by high-performance supercomputers that make it possible to quickly and efficiently model huge datasets, are revolutionizing subsalt imaging, Bognar claims. “Where once the industry relied on interpretations to estimate the subsurface, we are now able to be increasingly data-driven and rely more on the actual information in the seismic dataset,” he says. “This is made possible by the high quality of the seismic data, CGG’s advanced imaging technology, and the accuracy of the resulting velocity model.”
To that end, Bognar explains that the full-azimuth, long-offset OBN data acquired in the Mississippi Canyon will be used to generate an improved velocity model and clearer images of the complex subsalt-related geology in the area.
“The velocity model being developed with the new OBN survey will use our advanced full-waveform inversion (FWI) techniques. Since imaging and interpretation rely on the velocity model to reconstruct the subsurface from the seismic data, the better the velocity model, the better the image,” he explains, adding that the updated velocity model also can be applied to previous datasets in CGG’s library for improved imaging accuracy.
The overall permit area for the project is almost 1,900 square kilometers, says Bognar. “The survey will provide excellent offset and azimuth coverage for subsalt illumination,” he relates. Remotely operated vehicles were used to deploy the OBN equipment and roll the patch.
“Full-azimuth, long-offset data delivers the data required for higher-quality imaging compared to older technologies,” Bognar comments. “The goal is to have better clarity at depth to improve the image of a particular structure.”
During deployment and recovery, every proposed seabed node location was verified through visual inspection by a camera on the ROV. “There could be infrastructure or archaeological interference,” he notes. “We made sure that we maneuvered safely around all hazards and sensitive features.”
Elsewhere in the Gulf of Mexico, CGG announced in mid-June that it had completed the imaging of another nodal survey of the Mad Dog Field in the Green Canyon area for BP and partners. This ocean-bottom node survey also used CGG’s full-waveform inversion to produce a fast-track velocity model in a greatly reduced time frame, facilitating superior depth migration for imaging only weeks after delivery of the OBN data. Project cycle time was reduced by almost half while delivering greatly improved subsalt images.
Tailored To Smaller Operators
Lockhart Geophysical Company recently completed a 200 square-mile 3-D survey in Nebraska that was more than double the size of any previous project the company had conducted, according to Geophysical Technician Carlos Jimenez.
“Typically, we are tailored to the smaller operator/producer in Kansas,” he says, adding that in this case, the client chose Lockhart for its wired acquisition system. “The client wanted to see the data in real time because it was more comfortable with real-time data gathering with our cabled geophones.”
Lockhart began stepping out from Kansas fairly recently in response to opportunities in Nebraska and Colorado, namely the Niobrara Shale. In contrast to Kansas, where drilling targets are relatively simple, shallow conventional geologic formations and roadways are uniformly spaced one mile apart on grids across flat rural terrain, Nebraska and Colorado present surveying challenges.
“One recent project was in the hills of Fremont County, Co., where the terrain was extremely difficult,” Jimenez states. “We are willing and able to adapt to survey design challenges as needed with our wired system.”
In Wyoming, Lockhart has multiple jobs lined up for 2-D cabled surveys with intersecting lines. “Some operators prefer shooting 2-D for reconnaissance,” notes Jimenez. “If they see something that piques their interest, they will order a 3-D survey focusing on a particular area.”
Lockhart has plans to add wireless nodal systems in the future, given the advantage the technology has in crew size and efficiency, reports Jimenez. The company already has tested systems and achieved a reliability rate exceeding 99 percent. Nodal systems have a battery life sufficient to last for the duration of typical surveys conducted for operators in Kansas, he notes. “We can finish the job, charge, download data and move on to the next job.”
If the client wants to see some wireless nodal data in real time, Jimenez says the company plans to lay out a wired line so the client can see how the data is affected by strong winds or any other environmental conditions. And that, he points out, is the big advantage of cableless systems. “Nodes can be completely buried, you can make them almost disappear,” Jimenez comments.
He says the ideal solution for Lockhart is a true all-in-one node, where no wires are exposed. When there are no exposed wires, they are not an attractive nuisance for cows or other animals to tug on. “We spend about two hours a day troubleshooting problems that often happen because wires have been pulled or damaged,” Jimenez concludes.
More Science Required
Natural gas production from the Marcellus Shale is at record levels, but after more than a decade of concerted development, operators are beginning to venture outside the established fairways, according to Steve McCrossin, president of Precision Geophysical in Millersburg, Oh.
“With known sweet spots getting drilled up, operators are stepping out of their comfort zones and moving away from the core, which requires more science,” he states, noting that geologic conditions and reservoir properties can change dramatically from one part of the Marcellus play to another. “Operators are relying on high-resolution seismic to better understand noncore areas and properly define subsurface features for drilling hazard identification and derisking.”
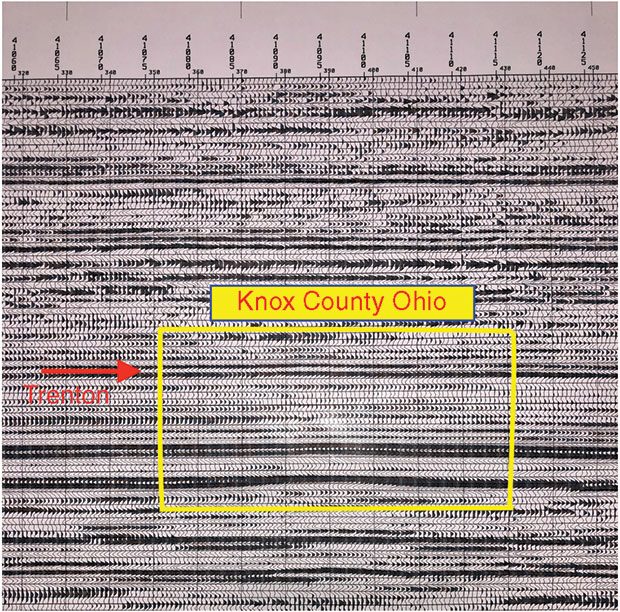
In late July, one of Precision Geophysical’s two seismic crews was acquiring a proprietary 3-D survey in the Utica Shale in Ohio, while the other crew was shooting a proprietary 3-D survey in the Marcellus Shale in Pennsylvania. One of the primary applications of 3-D in the Marcellus and Utica is geosteering laterals ‘in zone’ all the way to total depth.
Precision Geophysical maintains two crews equipped with the ARAM Aries™ 24-bit system and Geospace Sensors’ GS-32CT™ high-frequency geophones for both 2-D and 3-D recording with either cabled or cable-free (or both) acquisition methods. In mid-July one of the crews was working a project in the Utica Shale in Southeastern Ohio, and the other was working on a Marcellus project in Pennsylvania. “Both are proprietary 3-D shoots for oil and gas companies,” McCrossin reports.
Like other horizontal resource plays, one of the primary applications of 3-D in the Marcellus/Utica is geosteering laterals to total depth. “In the past, operators have found that horizontal wells often drilled in and out of zone,” he explains. “The uniqueness of 3-D seismic data, combined with logging-while-drilling data acquired at the bit, lets directional drillers keep the drilling assembly in zone all the way to planned TD.”
According to McCrossin, staying within the targeted zone is especially critical given the fast penetration rates that have become typical of Marcellus/Utica drilling, with operators regularly reporting daily horizontal footage rates of 4,500 or more. Of course, when drilling a mile of rock every 24 hours, drifting out of the target window for even 5-10% of the time can mean hundreds of feet of nonproductive lateral section.
“Fast drilling times have become routine for many Appalachian operators,” McCrossin comments. “Using seismic data for geosteering lets them achieve both high well productivities and high levels of horizontal drilling efficiency.”
Marcellus/Utica surveying challenges are related largely to the fact that the region is both heavily populated and has challenging terrain, McCrossin says. “Because of the congestion, the challenging part is getting surface permits so that there are not lots of areas within a survey layout where data cannot be acquired. It takes time to get all the permits, but it’s worth it.”
He adds that the company uses existing roadways to layout and deploy equipment whenever possible. “It can be a little scattered when we get into towns, but if you do a good job with the permitting and can get Vibroseis™ through the area, data quality can be kept consistent with minimal skipped areas,” McCrossin states, pointing out that the ARIES system also enables “live” analysis to ensure quality control as data collection proceeds.
“You can see the data in real time as it is being recorded,” McCrossin relates. “If quality starts falling off, we can increase the source energy or maybe determine that it is too noisy and temporarily hold up on shooting. There could be an airplane passing over some loud surface activity. Real-time QC is the only way to have this knowledge and accommodate for issues while recording is active.”
When coupled with the GS-32CT close-tolerance geophones for more usable data across the seismic bandwidth, he says ARIES also gives Precision Geophysical the flexibility to design richer and higher-density surveys to meet client needs in the Marcellus/Utica. “As operators step out into less proven drilling areas, they generally run Vibroseis reconnaissance 2-D lines to figure out where to focus follow-up 3-D surveys,” he remarks.
Then, the 3-D surveys are laid out on tight grids with closer line spacing, and often include larger recording patches to achieve longer offsets for wider azimuths, McCrossin explains. “Our projects typically have channel counts of 5,000-10,000, which enables the richer datasets and higher resolutions,” he concludes.
High-Density Survey
Almost a decade ago, Fairfield Geotechnologies set off to build a large contiguous database in the Delaware Basin. The DB1 survey conducted at that time had five times the density of previous surveys, collecting nearly 1.4 million traces per source square mile, says Joe Dryer, president of Fairfield Geotechnologies.
Then in 2017, the company’s Red Tank survey to the north increased coverage by 20 percent, with more than 1.6 million traces per source square mile for the same number of source points. “There was an immediate impact on image quality,” Dryer remarks.
Now Fairfield’s latest Permian survey, which began in early 2019, is 10.5 times the density effort at Red Tank, he reports. The C-Ranch project has 16.8 million traces per source square mile and 1,369 source points. “Trace density is now beyond what seemed possible only a few years ago,” states Dryer. “We believe the new parameters will greatly benefit rock properties characterization, improve signal-to-noise ratio, and result in better imaging.”
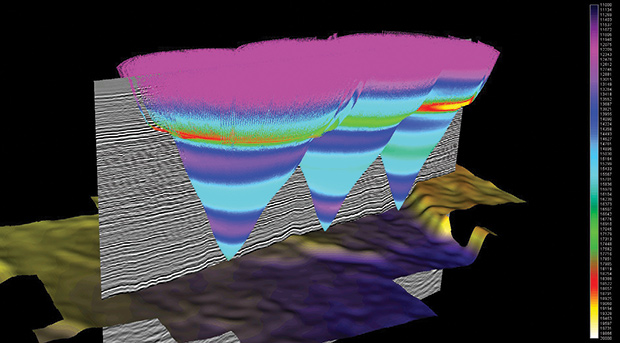
Fairfield Geotechnologies’ C-Ranch high-density survey in the Permian Basin has 16.8 million traces per source square mile and 1,369 source points. In some areas in the Permian, a shallow high-velocity anhydrite zone greatly complicates imaging. New survey parameters that densely sample the subsurface in offset and azimuth lead to better velocity models that improve imaging.
In South-Central Louisiana, Fairfield is partnered with CGG on a frontier Austin Chalk opportunity. The project is analogous to Texas in that a significant uplift in trace density will provide a better understanding of the formation, which has recently regained industry interest, Dryer notes. The project deliverables include AVO-compliant and inversion ready data for fast-track reservoir characterization.
Full-azimuth, long-offset 3-D data from these surveys offer the potential for significantly better insights into rock properties key in field planning, Dryer explains. “As data quality has improved, operators have increasingly looked to seismic data to find sweet spots,” he says. “Additionally, seismic is playing an increasingly important role in well spacing, lateral orientation and enhanced recovery.”
Trace density is particularly helpful in understanding the complex near-surface geology common in some areas of the Permian Basin. “Careful processing of high trace-density data helps see through seismic signal distortion caused by this complexity,” notes Dryer. “Adding knowledge of the subsurface and geologic constraints to the velocity model results in greatly improved seismic imaging, ultimately leading to greater exploration success with lower risk.”
Similarly, in the marine environment, new “sparse” ocean-bottom nodal geometries are acquiring long-offset, full-azimuth data required by imaging techniques such as full waveform inversion (FWI). “The expectation is that the resulting improved velocity model will result in significantly improved imaging,” says Dryer. “The same principal applies on shore, where new data, well sampled in offset and azimuth, is driving interest in FWI to get a more detailed near-surface velocity model.”
New acquisition geometries that result in significantly larger data volumes have led to other changes at Fairfield Geotechnologies. The company no longer has a physical computing center. “It is all about efficiency and scalability,” Dryer stresses, saying that the move to cloud computing enables the company to scale up computer resources on demand.
“We can bring thousands of processors to bear on raw survey data without incurring the cost of owning and maintaining the computing technology,” Dryer explains. “The cost is variablized, enabling us to deliver quantitative interpretation-ready data much faster and more cost efficiently than ever before.”
The value extractable from the data is tied directly to data quality and the quality of the data processing. To that end, Dryer points out that Fairfield Geotechnologies has seen an uptick in reprocessing related mostly to proper data conditioning for reservoir and rock property characterization.
He adds that Fairfield Geotechnologies has teamed with Ikon Science, which offers geoprediciton software and services. “We recognized early on that our clients were looking to get more out of their data. Our joint venture with Ikon Science is a good example of how we think interpreters can extract the most value out of their data,” Dryer observes.
He explains that the partnership gives clients the option to get an interpretation-ready dataset that puts them on the fast track to decision making, saying “Time is everything, particularly in unconventional plays. We streamlined the process from acquisition to interpretation, cutting the time to analysis dramatically.”
“These are exciting times for the industry,” Dryer concludes. “Denser surveys, precision processing techniques and unlimited computing power are leading to enhanced recovery rates.”
Revealing Critical Insights
Microseismic technology got its start as a means of measuring completion effectiveness. Now it has exciting new applications in evaluating wellbore spacing and placement, predicting well production, mitigating interwell interference, and even maximizing the return on investment for hydraulic fracturing treatments, says MicroSeismic Inc. President Peter Duncan.
“We can estimate the pressure drawdown around wells as a function of time,” says Duncan. “Pressure drawdown tells operators which stages along the lateral are producing hydrocarbons and which are not, and also reveals critical insights to answer questions about interactions among hydraulic fractures in multiple wellbores.”
After initial success in completion monitoring and analysis, MicroSeismic began using reservoir simulations based on microseismic data to predict production performance. A look back on three years’ worth of projects showed excellent history matching, says Duncan. To deliver specific value for reservoir engineers, however, he says, the company went a step farther to analyze well spacing and its related return on investment and net present value.
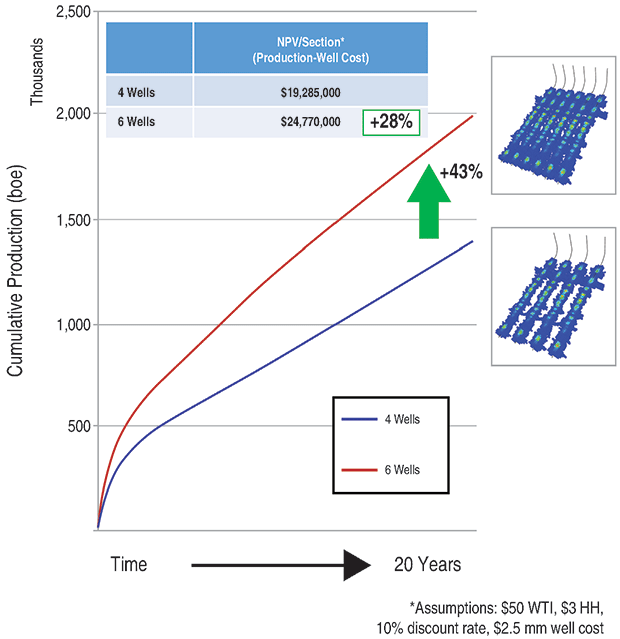
Going beyond stimulation monitoring and analysis, MicroSeismic Inc. is using microseismic data in reservoir simulations to predict production performance over time. As illustrated here, combining microseismic data with a proper economic analysis shows that a 50% increase in the well count per section would increase hydrocarbon production by 43%. That would be sufficient to offset the additional completion and operating costs associated with a six-well rather than four-well development plan and result in positive NPV.
“To prove the technology, we did a study in which we monitored wells in the Permian Basin and calculated pressure drawdown over time,” explains Duncan. “We started with four wells, then modeled and predicted returns for drilling additional wells per section.
“Adding two more wells yielded almost 50 percent more hydrocarbons, with a positive NPV of 28% after considering extra operating costs,” continues Duncan. “That was a good investment, but if we doubled the wells, there was only a 60 percent increase in hydrocarbons, taking the NPV negative compared to the base case.”
To get the most accurate modeling results, Duncan advises integrating as much available data as possible, including 3-D seismic, rock stress data, property data, and rock mechanics. “Microseismic adds a different perspective, for example, in identifying faults that have a more horizontal motion with very little vertical offset,” he explains.
Duncan asserts that this approach using microseismic integrated with other types of data is the ideal solution for evaluating wellbore spacing/placement in resource plays with multiwell pads. There is even interest among operators for applying the method to conventional reservoirs, although he says that would be a much more difficult analysis because conventional carbonate and sandstone-type reservoirs tend to respond to fracturing acoustically at much lower levels.
With a reservoir model in hand, engineers can have an idea of how each well should be stimulated to maximize return on investment. “They can watch the well treatment in real time and follow a template to see when the treatment reaches the goal,” says Duncan. “They also can monitor how the rock fractures and map the stimulated reservoir volume in real time to help prevent parent/child well interactions.”
Ultimately, the technology gives the operator the ability to make decisions in real time and make on-the-fly adjustments to the pump schedule during fracturing treatments to increase bottom-line well performance. “We are moving toward being able to judge the return on investment to the point of being able to say, ‘Fifteen more minutes of treatment will generate a net present value of X amount,’” concludes Duncan. “If NPV is positive, the treatment would keep going; if it is negative, treatment would stop.”
For other great articles about exploration, drilling, completions and production, subscribe to The American Oil & Gas Reporter and bookmark www.aogr.com.