


Reservoir Stimulation
Integrating Microseismic, Fracture Diagnostics Data Improves Stimulation Analysis
By Norm R. Warpinski, Michael J. Mayerhofer, Eric J. Davis and Eric H. Holley
HOUSTON–Successfully developing unconventional reservoirs, particularly shale source rock, requires a “systems” engineering approach that includes the reservoir, the wellbore, the completion, the stimulation, cleanup and flow back methodology, artificial lift, and production. An important part of this system is the interaction of the stimulation with the reservoir, wellbore and completion approach, because this is where the contact area between the reservoir and wellbore is initially developed.
When applied to the stimulation of oil and gas shale source rock, “complexity” is meant to be a condition in which the reservoir is sufficiently subdivided into discrete blocks contacted by either the propped hydraulic fracture or activated natural fractures that retain some degree of conductivity. Low-permeability liquids plays that require close fracture spacing obviously benefit from creating complexity in reservoirs where stresses and natural fractures are favorable for generating multiple fracture planes.
However, it is not usually clear where complexity can be developed, or even how to determine if complexity is being developed. Moreover, even with high-quality microseismic data, it is difficult to distinguish between multiple parallel planar fractures and a complex fracture network in horizontal wells with multistage, multiperforation cluster completions.
The industry has a relatively poor understanding of how the completion affects the initial fracture because tools such as microseismicity do not have sufficient resolution at the wellbore, and it is difficult to infer near-wellbore behavior from overall far-field microseismicity. Technologies that determine where fluid exits the wellbore during the stimulation process would be very beneficial in both optimizing treatment designs and controlling the fracturing process.
Microseismic provides critical information about fracture length, azimuth, height, asymmetry, overall complexity, general stage behavior, etc. However, microseismicity cannot provide the exact details of a fracturing process to allow a full understanding of stimulation behavior in unconventional reservoirs. While overall reservoir behavior can be surmised, key details such as the way a fracture volume is distributed often remain uncertain, making it difficult to determine exactly what changes would enhance fracture effectiveness. Such limitations are particularly prevalent in unconventional reservoir stimulations, where both completion and stimulation can be sources of complexity.
Additional information about the fracturing process can only be obtained with diagnostic technologies that provide additional insights into where fractures are initiating and how fluid and proppant volumes are distributed within the network. These include surface tiltmeters, downhole tiltmeters embedded in microseismic arrays, fiber optic distributed temperature sensing (DTS), and fiber optic distributed acoustic sensing (DAS) as well as more conventional tools such as tracers, flow tests, modeling, diagnostic injection tests, and production data analysis.
FIGURE 1
Measurements from Different Diagnostic Technologies
Diagnostic Technologies
Figure 1 shows measurements that can be achieved with various diagnostic tools to determine important fracture and completion parameters. In horizontal wells in unconventional reservoirs, it is imperative to have the far-field technologies to understand the dimensions of the overall fracture network, but it is also important to have wellbore technologies to determine initiation conditions, isolation, diversion and staging effectiveness.
As is obvious from this figure, no single solution can provide enough information to fully understand and optimize fracturing. However, integrating other diagnostic technologies with microseismic analysis can be extremely valuable for optimizing stimulations by enhancing the understanding of microseismicity and extracting more detailed information about the fracturing process, completion scheme, staging and other relevant development details.
The stimulated reservoir volume (SRV) is potentially a measurement of the size of the region in which permeability has been sufficiently enhanced. Unfortunately, it is impossible to discern from microseismicity alone whether the SRV has conductivity throughout its volume. It cannot be known whether the small shear slippages (or even ones with some volumetric component) actually indicate dilation of activated natural fractures that might be sufficient to allow some proppant to enter and provide retained conductivity.
FIGURE 2
Microseismic Interpretations for
One Stage of Marcellus Stimulation
Figure 2 shows a microseismic dataset of a single stage of a multistage, five-perforation cluster stimulation in a Marcellus Shale well, and possible interpretations of the microseismic distribution. Whether there are a few planar fractures, orthogonal conjugate fractures, a single planar main fracture with a subsidiary network, or if the correct interpretation is something else, can be unclear. It can also be difficult to determine whether all of these alignments are real, or if some are coincidental.
Moreover, it is not clear whether clusters two and four accepted any fluid during stimulation, and it is possible that clusters one and five accepted only minimal fluid. There is a good possibility that most of the fracturing occurred through the center cluster, but that is impossible to quantify using microseismicity alone.
Surface Tiltmeters
Surface microdeformation using an array of tiltmeters is the only technology that can determine the volumetric distribution of a complex fracture system. Figure 3 shows the expected normalized surface deformation for a single vertical fracture, two orthogonal fractures with one twice as long as the first, five parallel planar fractures spaced 50 feet apart, and two equal fractures at azimuths that are 45 degrees apart. Orthogonal fractures and two fractures at different azimuths result in very different deformation patterns than does a single fracture.
In addition, the deformation pattern for a single fracture is indistinguishable from multiple parallel fractures that are closely spaced relative to depth (50 feet in this case, but even 100-foot spacing would be indistinguishable). Although this behavior makes it impossible for tiltmeters to determine how many fractures might be generated in a stage, they can provide definite information on how much deformation (essentially how much volume) is developed in each azimuth, regardless of fracture system complexity. In this way, the proportional injected volume into each azimuth can be determined.
FIGURE 3
Surface Deformation Patterns for
Various Fracture Geometries
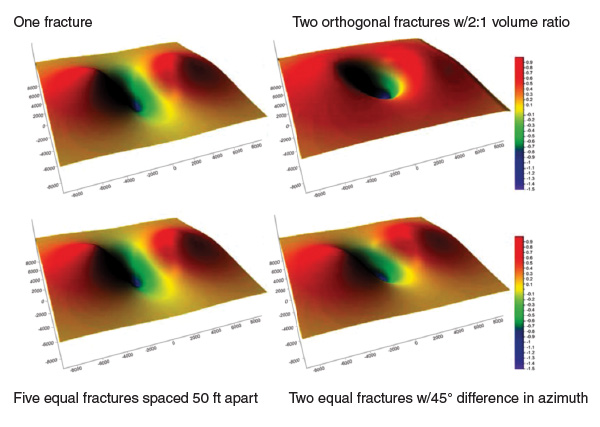
FIGURE 4
Surface Deformation for
Horizontal Fracturing versus Other Situations
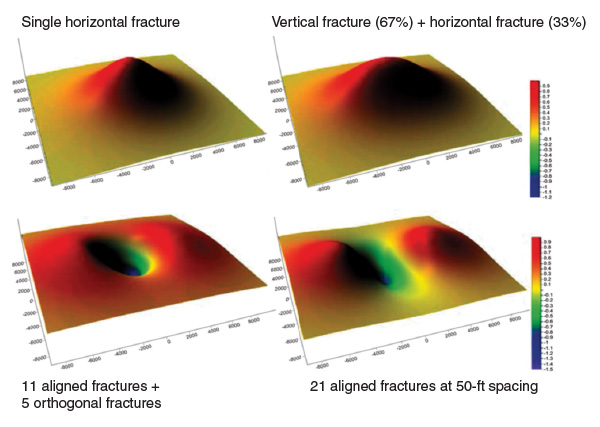
Horizontal fracturing is another feature that is not easily resolved with microseismicity because a horizontal fracture generally will resemble a relatively well-contained vertical fracture network. However, horizontal fractures are easily distinguishable from vertical fractures using surface microdeformation, and combined horizontal and vertical components also can be differentiated and resolved.
Figure 4 shows four examples of the expected normalized surface uplift from a horizontal fracture: a single horizontal fracture, a horizontal and vertical fracture with a volume ratio of 1-to-2, a network with 11 parallel fractures spaced 50 feet apart and five orthogonal fractures with the same spacing, and a set of 21 parallel fractures spaced 50 feet apart. The first point is that a horizontal fracture has a very different uplift pattern that either a single fracture or orthogonal fracture network (Figure 3).
There also are some misconceptions that a fracture network would resemble a horizontal fracture, but this is clearly not the case for either a conjugate network (bottom left) or a parallel network (bottom right). Combinations of horizontal and vertical fractures tend to appear more horizontal in their uplift, as shown in the top right panel, because the surface uplift from a horizontal fracture at depth is much greater than the surface uplift from a vertical fracture. Nevertheless, the uplift in the upper right panel is highly elongated when the two fractures are combined, and the difference between it and a single horizontal fracture can be resolved readily in an inversion program.
Surface microdeformation remains the only geophysical method that can provide the volumetric split of the injection volume into separate components (intersections with offset wells provides a direct physical method). Without such data, it is unclear whether widespread microseismic data are indicative of the development of a dilated network in which proppant and residual conductivity are possible, or if there is merely some shear movement that does little to enhance productivity.
Fracture Height Growth
Microseismicity usually is considered a relatively good indicator of the presence of a hydraulic fracture or fluid associated with a fracture. Microseismicity can be induced in the tensile region near the fracture tip caused by the stress changes induced by the pressurized fracture, as well as in the broadside of the fracture only if there is reservoir pressurization caused by leak-off of high-pressure fracturing fluid, presumably into natural fractures or bedding planes.
The one exception is the stress conditions around the upper and lower tips of a highly elongated hydraulic fracture, which potentially result in shear slippages and microseismic activity both above and below the fracture. Whether slippage actually occurs depends on many factors, including in situ stresses, the orientations of existing planes of weakness, pore pressure, the cohesion of weakness planes, and the effects of layering in either amplifying or attenuating the stresses. Nevertheless, it is possible in some situations to have stress effects that induce microseismicity well above or below an elongated fracture.
In a number of cases, microseismicity has been shown to skip layers and appear either shallower or deeper without any obvious connection between microseisms in the fracture interval and those exterior to it. This is likely fault-related in some cases, but could be caused by other factors in some reservoirs. In either case, it is unclear what the fracturing condition is in these regions and whether significant amounts of fluid are involved.
The only other available far-field method to investigate true fracture height is measuring downhole deformation in the treatment well or offset wells, which can be achieved with downhole tiltmeters. The treatment well is a very difficult environment for any measurement, but nearby monitor wells offer a potential site for accurate measurement of deformation induced by hydraulic fracturing. Because tiltmeters can be run with microseismic tools in a single hybrid array, both microseismicity and deformation can be measured at the same time.
The application of hybrid arrays is somewhat limited because tiltmeters must be at the same depth as the deformation they are measuring, and because deformation becomes too diffuse at distances much greater than 600 feet, depending on height and pressure.
The monitoring of horizontal well stimulations in unconventional reservoirs is optimal when tiltmeters straddle the fracture. But even when tiltmeter tools are above the reservoir, they can provide information on whether deformation is occurring above or if the microseismicity is related to any fracture dilation. The fracture must pass broadside to the monitor well, so the plan view placement is important. Wells that are very far from the horizontal, or past the toe or heel, will not be suitable. Nevertheless, for those applications where monitor wellbores are situated optimally, hybrid microseismic/microdeformation arrays can provide important information on fracture-height behavior.
Downhole microdeformation measurements and fracture heights inverted from those data are very complicated, but microseismic provides valuable constraints (azimuth, length, distance to fracture, etc.) for improving inversion and interpretation results. Regardless of the interpretation, the question of whether deformation is occurring over some depth range should be unequivocal if the monitoring geometry is appropriate. When integrated with microseismic results, a much clearer description of the fracture can be obtained for further modeling and optimization.
It is worth noting that a downhole tiltmeter array also can measure fracture width. In some cases, it may be possible to determine width during injection and after closure to approximate the propped height. In unconventional reservoirs, this is generally impractical because of multiple stages and long closure times, but it is a possibility in some applications.
Fiber Optic Monitoring
Only in a small number of ideal situations is microseismicity sufficiently precise to provide information on the fracture in the near-wellbore region. However, real-time control of fracturing, optimization of perforation clusters and correct stage spacing, as well as design, modeling and analysis of results would be significantly aided by better understanding initiation conditions at the wellbore.
Precise fracture monitoring measurements within the wellbore are available now using fiber optic-based temperature and acoustic sensing technology. Particularly when the fiber is deployed permanently behind pipe, DTS can provide detailed information about zonal isolation, injection locations, and gross volumetric estimates by means of warm-back profiles for typical plug-and-perf operations. DTS can also be used for open-hole completions and in vertical wells.
Figure 5A shows a temperature color plot of DTS data obtained from an 11-stage stimulation in a vertical Permian Basin well using a limited-entry, plug-and-perf completion. Results would be similar for a horizontal well, except that vertical well monitoring offers the potential to measure fracture height at the wellbore.
FIGURE 5A
DTS Data for 11-Stage Limited-Entry Treatment
(Vertical Well)
FIGURE 5B
DAS Data for Stimulation of Two Perforated Intervals (Vertical Well)
The blue colors represent cool temperatures, while the red colors indicate warmer temperatures. Perforation intervals are marked by the thin horizontal white lines. The blue vertical zones highlight injection periods when fluid in the wellbore is cool. Areas of extreme cooling, where fluid has contacted the tubing holding the fiber outside of the pipe, show where injection is contacting the rock. But the warm-back after injection is the most valuable information for determining where the fluid volume is concentrated. Warm-back occurs relatively fast where injected volumes are small, but the cool region can persist for many hours where volumes are large.
Similarly, DAS can be used as a noise log to monitor fluid injection points and production intervals, as well as ball seats, perforation gun locations and firings, plug settings, and isolation between plugs or packers. As a gross approximation, the amount of fluid injected into each perforation cluster can be estimated by the amount of noise at those perforations, although more work is required to understand the effects of perforation quality and number of open perforations in each cluster relative to both fluid properties and proppant effects. Where diverters are used, the changes in acoustic signatures can provide information on whether the diversion is successful.
Figure 5B shows data from a vertical well in which two perforation intervals were fractured using a limited-entry design. The red colors denote high noise levels resulting from fluid accelerating through the perforations into the fractures. In this case, both sets of perforations were generating similar noise profiles throughout most of the stimulation, indicating that the limited entry was appropriate for this interval. The decrease in noise in the top interval toward the end of the stimulation appears to correspond with a slight increase in noise in the lower interval, suggesting that the lower interval likely will contain slightly more proppant.
These distributed sensing diagnostics provide a methodology for determining where fluid is entering the formation, how it is likely to be distributed volumetrically, how well the completion is performing relative to expectations, and how stage spacing and perforation cluster spacing influence volumetric distribution. When integrated with microseismic data, surface microdeformation data and models, there is much more potential to determine how the wellbore/completion/stimulation system is performing. Fiber optic diagnostics also have the potential to provide real-time control by monitoring slurry distribution along the stage length.
Integrated Fracture Model
Fracture diagnostics are particularly valuable if the results can be incorporated into models to predict and optimize stimulation and production behavior. With planar fracture behavior, implementing calibrated models is relatively straightforward. More complicated completions, such as those in shale reservoirs, require either more sophisticated models or integrating additional knowledge, such as the information obtained from fiber optic sensing. In either case, diagnostic information is absolutely necessary to calibrate the models and apportion flow.
Microseismic data are particularly useful for model integration because they help describe the size of the entire stimulated region. DTS and DAS provide information about the distribution of fluid into the individual perforation clusters or stages. Surface tiltmeters provide the volumetric estimates to calibrate the network behavior where it exists. Downhole hybrid arrays can provide a more certain measurement of fracture height. Other diagnostics–including tracers, production data and well testing–also can be useful in interpreting reservoir behavior.
Calibrated models, whether planar or complex, provide the best potential for estimating where proppant is likely to be located at the end of a fracturing treatment. No diagnostic tool actually “sees” proppant in the far-field. Microdeformation provides information on fracture dilation and likely regions where proppant could be located. DAS and DTS help in understanding where fluid has entered the formation during proppant stages. Only with a model, however, is it possible to predict where proppant is likely to be located after injection stops and a fracture closes.
FIGURE 6
Integrated DTS and Microseismic (Cased, Cemented Wellbore with Four Perforation Clusters)
FIGURE 7
Match Between Modeled (Green Curve)
And Actual (Black Curve)
Net Treatment Pressure With Microseismic Data
(Orange Dots)
FIGURE 8
Calibrated Fracture Model Geometry
(All Perforation Clusters)
Figures 6-9 illustrate how near-wellbore DTS data and far-field microseismic data can be used in conjunction with fracture and reservoir models to optimize well spacing. This dataset has been modified and adapted from actual field data to better illustrate the integrated methodology and maintain project confidentiality.
Figure 6 shows integrated DTS and microseismic data for one fracture stage with four perforation clusters in a cased and cemented horizontal well. The DTS data indicate that the greatest cooling and slowest warm-back are at the outside perforation clusters, with less cooling and faster warm-back at the inside clusters.
The microseismic data show fairly planar fractures and confirm better stimulation with longer and slightly taller fractures at the outside clusters, while the two inside clusters are understimulated with shorter fracture lengths. The overall width of the microseimic event cloud does not suggest significant large-scale multidirectional fracture complexity, implying that a planar fracture modeling approach should be sufficient to describe the primary hydraulic fractures.
Long-term DTS warm-back data and microseimic data then can be used to fine-tune the fluid distribution percentages to each cluster. Advanced quantitative methods of fracturing fluid distribution per cluster using DTS and DAS data are under development, but in this case, fracture lengths based on microseismic data across the four clusters provide an excellent calibration anchor point.
Optimized Well Spacing
Figure 7 shows the calibrated fracture model with microseimic data, conductivity distribution and fracture treatment net pressure match for one of the perforation clusters. The green curve is the modeled net pressure, the black curve is actual net pressure, and the orange dots are microseismic data at the cluster. Figure 8 shows the final calibrated fracture model results for all four perforation clusters. The blue lines represent calibrated fracture model geometry based on a certain percentage of fluid distribution to each perforation cluster.
The model matches the microseimic event distribution very well. In this process, DTS data were used qualitatively as a starting point for injection rate distribution to each cluster, and then modified until the microseismic geometry was matched at each perforation cluster.
The fracture model geometry and conductivity distribution at each perforation cluster then were imported into a reservoir model. Figure 9A shows the reservoir modeling results for reservoir pressure distribution, with the drainage area implied as a function of depletion extent. Reservoir system permeability was assumed for this example, but normally would be obtained from rigorous production history matching and other constraining cross-well diagnostic data. The created fracture system was assumed to be fully effective, based on modeled fracture conductivity distribution, but could be constrained further with cross-well diagnostic data.
FIGURE 9A
Reservoir Model for Calibrated Fracture Stage
Showing Drained Area as Function of
Variable Fracture Lengths at Each Cluster
FIGURE 9B
\Well Spacing Evaluation
The reservoir model shows the impact of shorter fractures at the middle perforation clusters and their inability to achieve optimum drainage in a very low-permeability unconventional reservoir.
The final step is using the reservoir model to forecast how different well spacing scenarios could impact reserves recovery, production acceleration, and overall development scenarios. This is shown conceptually in Figure 9B. The top part of the figure (wells 1 and 2) depicts well spacing that is too large based on the extent of effective fracture stimulation, resulting in lost reserves. In practice, this scenario is of highest concern for oil and gas operators because it would be much more difficult and costly to recover the reserves at a later time (drilling infill wells and facing the challenge of effective fracture stimulation near an offset well with low-pressured hydraulic fractures).
In contrast, the bottom part of Figure 9B (wells 2 and 3) shows a well spacing that is potentially too tight, with significant drainage overlap from fractures. This scenario could result in overcapitalization and potentially uneconomic development (insufficient cumulative hydrocarbon recovery per well). Assuming a 100-well development program, increasing well spacing by 20 percent would save drilling an additional 20 wells. For an unconventional play with an average well cost of $8 million, this would reduce development cost by $160 million.
In conclusion, microseismicity is an invaluable technology for understanding hydraulic fracture behavior, but many complex issues cannot be resolved using microseismicity alone. The main goal of integrating fracture diagnostics should be to aid the development and calibration of realistic models for analyzing, designing and predicting the performance of the stimulations and resulting production.
While this often requires complicated workflows and calibrating unknown reservoir data, the insights from such modeling can be extremely valuable for optimizing unconventional development and ensuring the proper balance of reserves recovery and capital expenditures. The enormous economic impact of lost reserves and overcapitalization shows the importance of a well-designed integrated fracture diagnostic evaluation program that will enable a faster learning curve to make better decisions early in a full-scale field development program.
Editor’s Note: For more detailed information on the microseismic and diagnostic technologies and applications discussed in the preceding article, see URTeC 1917906, a technical paper presented at the 2014 Unconventional Resources Technology Conference, held Aug. 25-27 in Denver.
NORM R. WARPINSKI is a technology fellow at Pinnacle, a Halliburton service, in Houston. He worked at Sandia National Laboratories from 1977 to 2005 on various projects in oil and gas, geothermal, carbon sequestration, waste repositories, and other geomechanics issues. Warpinski has extensive experience in hydraulic fracture mapping and modeling, and has been involved in large-scale field experiments from both the hardware and software sides. He holds a B.S. in mechanical engineering from the Illinois Institute of Technology, and an M.S. and a Ph.D. in mechanical engineering from the University of Illinois.
MICHAEL J. MAYERHOFER is director of the Fracturing Center of Excellence at Pinnacle, a Halliburton service. He leads a team of engineers providing advanced fracture engineering solutions with special emphasis on unconventional shale and tight gas plays. His responsibilities include applying tiltmeter and microseismic hydraulic fracture mapping results for optimizing fracture completion, well placement and infill drilling strategies, designing and evaluating hydraulic fracturing treatments, reservoir engineering, and integrated field studies. Mayerhofer holds a Ph.D. in petroleum engineering from Mining University Leoben in Austria.
ERIC J. DAVIS is director of technical development at Pinnacle. He joined the company in 1996, and is responsible for developing equipment, software and analysis methods, including tiltmeters, geophones, accelerometers and fiber optics. Davis holds a B.S. in engineering from Cornell University and a master’s in engineering from the University of California, Berkeley.
ERIC H. HOLLEY is product line manager for unconventional resources at Pinnacle, where he manages the technical development, market tactics and product launch for all Pinnacle products for application in unconventional resource plays. Previously, he had served as global product champion of StimWatch™ fiber optic technology, project manager of microseismic and fiber optic diagnostics, and stimulation field engineer in Halliburton’s Rocky Mountain region. Holley holds a B.S. in astronautical and aeronautical engineering from Purdue University.
For other great articles about exploration, drilling, completions and production, subscribe to The American Oil & Gas Reporter and bookmark www.aogr.com.