


Well Productivity Drivers
Project Studies Impact Of Faulting And Fracturing On Eagle Ford Productivity
By Paolo Grossi
THE WOODLANDS, TX.–With natural and hydraulically induced fracture permeability largely dictating well performance in unconventional reservoirs, the geoscientist’s “tool kit” requires innovative techniques to bridge the gap between various geoscientific and engineering disciplines.
A project conducted by Talisman Energy USA (a part of Repsol) in the Eagle Ford Shale in La Salle County, Tx., investigated the effects of natural fractures on well deliverability, focusing on multidisciplinary methods to explore complex interactions between hydraulic and natural fractures.
The results demonstrate how seismic-based regional structural models, well site and produced gas data, core analysis, formation microimaging (FMI) logging, buried-array microseismic data, and completion flowback data can be used to predict both positive and negative productivity impacts associated with various fault/fracture interactions.
In central and eastern La Salle County, normal faults have a northeast-to-southwest regional trend with throws of 50-150 feet. The faults segment portions of the productive Eagle Ford trend into distinct fault blocks. Mechanical stratigraphy and disproportionate fault propagation create varying stress and fracture orientations, especially within the transfer zones where relay ramp structures have developed. Relay ramps are a common feature. They occur between overlapping normal faults and accommodate displacement transfer between adjacent structures.
FIGURE 1
Schematic of Relay Ramp Structures
in Eagle Ford Study Area
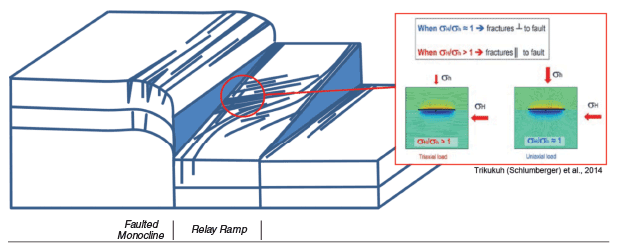
In normal fault regimes, fracture orientation is related not only to fault geometry, but also to a region’s far-field stress ratio. In areas where the ratio of maximum-to-minimum horizontal stress (SHmax/SHmin) is greater than 1.0, fractures will tend to develop parallel to normal faults. Conversely, fractures will tend to develop perpendicular to normal faults in areas with SHmax/SHmin stress ratios equal to 1.0. Stress perturbations may occur around relay ramps, allowing a natural fracture (joint) set to form parallel to the orthogonal (SHmin) stress direction (Figure 1).
Given that these fractures are relatively recent, the regional far-field stress state is likely similar to conditions at the time of fracture formation. Therefore, these features are more likely to be open and conductive, compared with the regional SHmax parallel fracture sets. In addition, a low stress bias (stress ratio equal to 1.0) favors fracture complexity during stimulation, which can increase dramatically the stimulated reservoir volume (SRV), and more specifically, the stimulated surface area.
Structural Framework
High-resolution 3-D seismic was used to interpret all major horizons above and below the Eagle Ford. Horizons were depth converted and utilized in a 3-D structural geomodel. Within the geomodeling software, numerous surface attributes were computed and compared. Through various iterations, surface-derivative mapping utilizing dip azimuth and dip angle were found to be the most useful attributes in discerning major structural features, and in linking regional and field-specific structural features.
Regional faults, developed parallel to SHmax, may be discriminated more effectively from features developed orthogonal to regional fault trends using these methods (relay ramps and associated fault normal fracture sets). Figure 2 shows dip azimuth (left) and dip angle (right) to the top of the Buda formation immediately below the Eagle Ford. The numbers denote examples of the main structural features that are evident:
- A relay ramp transfer zone with a southwest-dipping ramp with orthogonal (SHmin parallel) fault/fracture features (1);
- Regional, through-going (SHmax parallel), large-displacement normal faults marked by the dashed black lines (2);
- A transfer zone with a regional southeast dip (3); and
- A steeply dipping monocline (4).
FIGURE 2
Top of Buda Dip Azimuth (Left) and Dip Angle (Right)
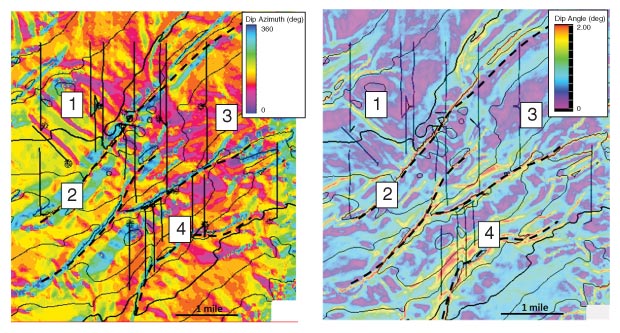
Source: Three-D seismic data owned by Global Geophysical
Because initial Eagle Ford development was based largely on lease retention and drilling obligations, wells were drilled through all types of identified structural features, creating an appreciable dataset to evaluate the positive and negative productivity impacts of such features. Along with production metrics, many wells have C1-C5 mud gas logging, completion flowback water salinity, buried array microseismic, and produced gas isotope data. These datasets were integrated with vertical (pilot) well data, including core and FMI logs.
Mud Gas Analysis
Drilling reports and mud logs were reviewed to identify major gas kicks or related well control issues, which are known to be an initial indicator of potential natural fracture systems in low-permeability reservoirs. The study also reviewed gas chemistry variations using gas wetness ratios, and assessed normalized total mud gas by dividing total gas by the drilling rate of penetration and applying a Fourier transform scan line analysis. These results were correlated to the mapped structural features.
Examples of large gas kicks or well control issues were evident in 10-15 percent of total wells. Commonly, large gas kicks were two to four times higher than background gas readings, and in some cases, involved long periods of mud circulation, surface gas flaring, and well shut in. In a majority of these cases, well paths traversed seismically resolvable northwest-to-southeast features within interpreted relay ramp structures. In a few instances, well paths crossed northeast-to-southwest features within steeply dipping monocline features.
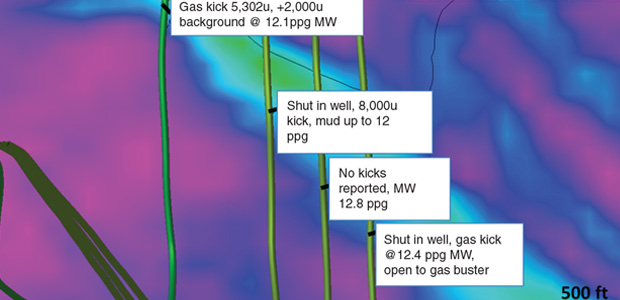
FIGURE 3
Mud Gas Analysis of Four Horizontal Eagle Ford Wells
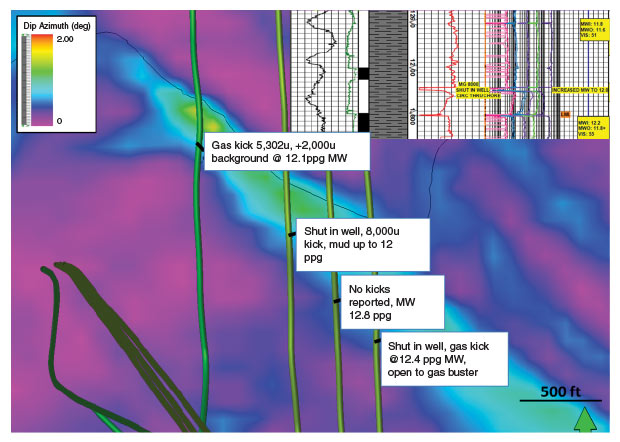
Source: Three-D seismic data owned by Global Geophysical
Figure 3 is an overhead view (the top of image is north) of four horizontal wells drilled through a moderately dipping northwest-to-southeast fault feature associated with a relay ramp structure. Three of the four wells were drilled slightly underbalanced, allowing for pronounced gas kicks. The top right inset image shows that a gas kick of 8,000 units caused one of the wells to be shut in and then circulated out to flare for an extended time.
Correlating gas ratios (i.e, gas wetness) to mapped structural features proved difficult, but in all instances, variations in gas wetness ratios corresponded to wells that drilled through major regional northeast-to-southwest seismically resolved normal fault features. When crossing these features, many ratios indicated decreased gas wetness, which corresponds to a gain of light ends and/or loss of heavy ends. The former is interpreted to be the main reason for this observation, with regional normal fault systems creating the necessary pathways for highly mobile lighter hydrocarbons (methane) to migrate from deeper stratigraphic sources.
In outcrop studies, fracture measurements along a traverse line can be analyzed using a Fourier transform to infer the relative intensities (amplitudes) and frequencies of natural fracture sets. This technique was adapted by using normalized total mud gas as the scan line input for the Fourier transform. The analysis differentiated two main subsets of wells: those with several dominant (high-intensity/amplitude) frequencies below 0.02 cycles/foot (specifically at 0.0125 and 0.006), and those with unresolved frequencies below 0.02 cycles/foot.
From the subset of wells with dominant frequencies below 0.02 cycles/foot, 80- and 160-foot fracture frequencies could be calculated. Comparing this with seismically resolved features was difficult, since in most cases, seismic features occurred at frequencies several times larger (500-1,000 feet). Nonetheless, the paths of all wells with resolvable frequencies below 0.02 cycles/foot traverse identical seismic features to wells that encountered large gas kicks.
Completion Flowback Data
The produced water flowback dataset consisted of all producing horizontal wells with similar completion designs, allowing a wide range of produced water salinities and oil-gas-water ratios (OGWRs) to be observed throughout the field. When cross-plotted, observed salinities and OGWRs developed a boomerang-shaped (hyperbola) pattern. This “boomerang curve” shows that wells with high OGWR follow a decreasing salinity path (15,000 to 7,500 ppm Cl), wells with moderate OGWR have the lowest salinities (less than 7,500 ppm Cl), and wells with low OGWR follow an increasing salinity path (7,500-25,000+ Cl).
FIGURE 4
OGWR versus EUR (Left)
and Produced Water
Flowback Salinity (Right)
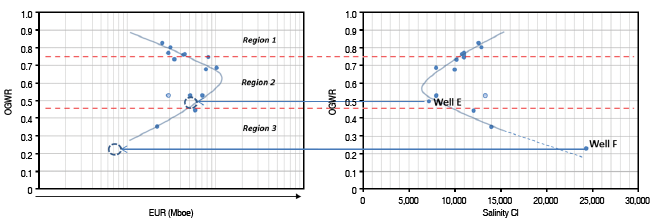
The three OGWR/salinity relationships are denoted as regions in Figure 4 using flowback data from new wells E and F. Interestingly, the boomerang pattern is mirrored when flowback OGWR is plotted against estimated ultimate recoveries. This observation is profound, suggesting that routine flowback information can be used as an early indicator of long-term well productivity.
In addition, OGWR/salinity relationships correspond to three distinct groups of wells located within varying inferred structural features. High-OGWR/high-salinity wells reflect those drilled in transfer zones with regional dip and limited or no relay ramp features. Moderate-OGWR/low-salinity wells are located in relay ramp areas with counter-regional (southwest dip) and seismically resolved SHmin parallel faults/fractures. Low-OGWR/high-salinity wells are those in which some portion of the well path drilled through large regional (SHmax) faults/fractures.
The connection between variations in flowback water salinity and interpreted structural features enforces that early-time salinities are a direct indicator of hydraulic fracture growth, complexity, extent, and interactions between pre-existing features, with the resulting SRV dictating well productivity.
Microseismic Events
More than 75 percent of wells completed in central and eastern La Salle County since 2009 have been monitored using a permanent buried microseismic array. The buried array consists of 90 stations covering 15 square miles, each with three channels at varying depths (270 total channels).
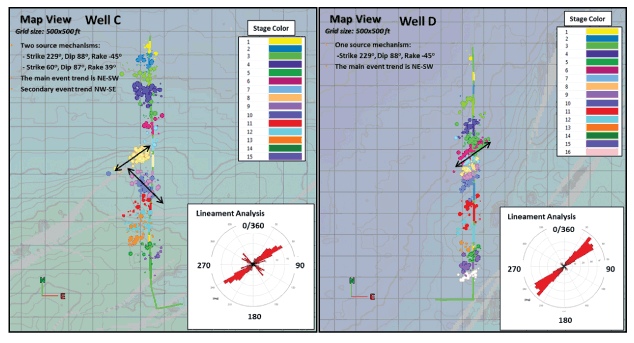
The main deliverables of microseismic acquisition are estimates of overall induced fracture geometry (height and length), event location and amplitude, source mechanism identification, and lineament analysis. Lineament analysis (direction/orientation of microseismic event trends through time) is a direct way to infer fracture energy propagation and growth behavior. Within the field, lineament analysis suggests the dominant fracture growth orientation is 30-60 degrees northeast-to-southwest. These data are consistent with regional stress data, and parallel regional faults. The typical source mechanism behavior of these events is dip-slip (210-240/85-90).
In certain areas, an additional lineament orientation is observed that trends orthogonal to the dominant direction, or 130-160 degrees northwest-to-southeast. In some instances where this orientation is observed, a second source mechanism also is present: reverse dip-slip to strike-slip (60-70/85-90). This second orthogonal lineament orientation is parallel to surface attribute features in interpreted relay ramp structures. This suggests that within these features, a low stress bias and/or an orthogonal northwest-to-southeast joint set allows for complex fracture growth.
FIGURE 5
Event Locations and Amplitude Displays
(Two Wells in Different Structural Environments)
Source: MicroSeismic Inc.
The observed secondary source mechanism may yield additional insight into these features, perhaps confirming the existence of an open and conductive joint set with the 60-70/85-90 source mechanism failure planes, representing en echelon “twist hackle” fractures that form as mode 1 dilation occurs.
Figure 5 shows event locations and amplitude displays for two wells in distinct structural environments. Well D has a single source mechanism. Well C exhibits more complex fracture growth (the zig-zag lineament pattern seen in the map view with orthogonal lineament directions), as well as an observed second source mechanism (60/87).
Microseismic events and amplitudes also hold valuable information regarding the quantity and size of fractures generated during treatment. An event/amplitude ratio parameter was developed to represent the ratio of event count to the average event amplitude normalized to lateral length. This ratio’s applicability was discovered by its strong empirical relationship to the rate transient parameter Sqrt(km)*Acm (or Arootk), which has been found to have extensive applicability in characterizing low-permeability reservoirs.
Defined as the product of the total matrix surface area draining into the productive fracture system and the square root of matrix permeability, the Arootk parameter is computed per well and normalized by lateral length. Interestingly, the cross-plot of Arootk and event/amplitude ratio created two distinct well populations with nearly identical linear trends. The relationship observed within each trend is seen as an increase in length-normalized Arootk with an increase in the length-normalized event/amplitude ratio (Figure 6A).
FIGURE 6A
Arootk versus Microseismic Event/Amplitude Ratio
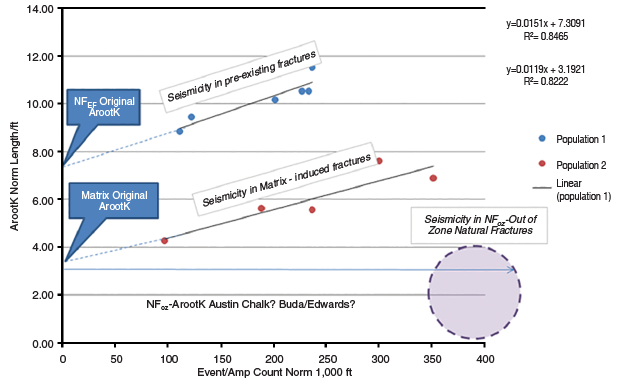
FIGURE 6B
Two Well Population Trends in Varying Structural Environments
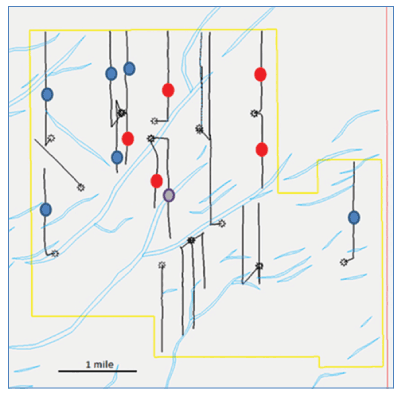
These two trends correspond to wells located in varying structural environments (colored points on Figure 6B). Wells with high Arootk versus event/amplitude are within relay ramp structures that typically cross northwest-to-southeast fault features. Low Arootk versus event/amplitude wells are on the edge of such features or within transfer zones with dominant northeast-to-southwest regional attribute orientations.
The reason for the strong empirical relationship between these two parameters may be that the event/amplitude ratio is related to the generated fracture surface area created during stimulation. This implies that an open and conductive joint set is present and mode 1 failure is fairly prevalent, explaining why the linear trends are so similar despite a bulk shift in Arootk values.
Isotope, Core And FMI Analysis
The study analyzed wellhead produced gas using C1-C3 (methane, ethane and propane) isotopes. Various molecular and isotopic gas composition ratios were computed and mapped to identify trends and anomalies. For example, the ratio of produced gas methane isotope-to-gas wetness was mapped across the field (both values are known to systematically increase with thermal maturity).
Within the La Salle County field, thermal maturity increases northwest-to-southeast (downdip). While the overall downdip maturation trend was evident in the mapped data, there were several anomalous areas with high ratios that corresponded to wells drilled through large regional northeast-to-southwest normal faults.
Anomalously high mature gas also is being produced by several wells located within a fault block bounded by two large northeast-to-southwest normal faults, suggesting that high maturity gases originating outside of the Eagle Ford in the underlying Georgetown/Edwards are mobile within the system where pre-existing normal faults are present.
Core and FMI analyses yielded insights into natural fracture joint sets and validated the seismically resolvable features interpreted from attribute mapping (Figures 7A and 7B). A visual identification of fracture types was conducted on a continuous 150-foot cored section taken from the center of a relay ramp structure roughly 500 feet from a prominent northwest-to-southeast oriented surface attribute feature in the field.
FIGURE 7A
Main Fracture Types from Core/FMI Analysis
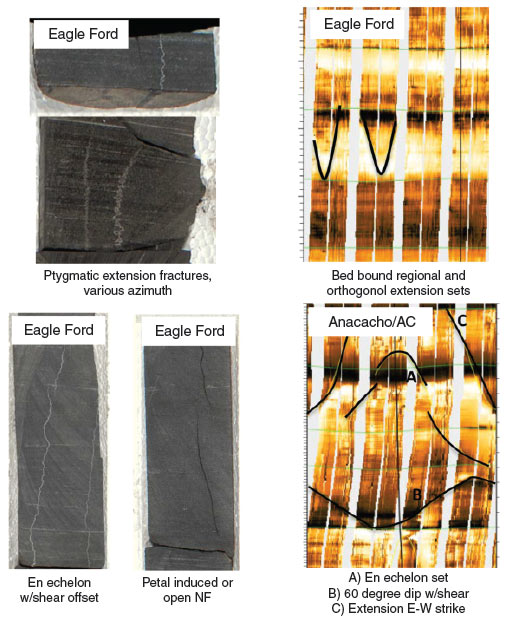
FIGURE 7B
Fracture Orientations from Core/FMI Analysis
Source: Three-D seismic data owned by Global Geophysical
A total of 45 joints perpendicular or near-perpendicular to bedding were observed. Of them, 36 were interpreted as drilling-induced, five were high-angle calcite cemented, and four were potential high-angle open to partially open.
A high-resolution FMI log was acquired in the field last year in a near-vertical pilot hole that was planned to intersect one of the major regional northeast-to-southwest oriented faults and reach total depth on the edge of a relay ramp structure. The main fault was crossed about 100 feet above the top of the Eagle Ford, cross-cutting mixed carbonate and shale lithologies of the Basal Anacacho and Upper Austin Chalk.
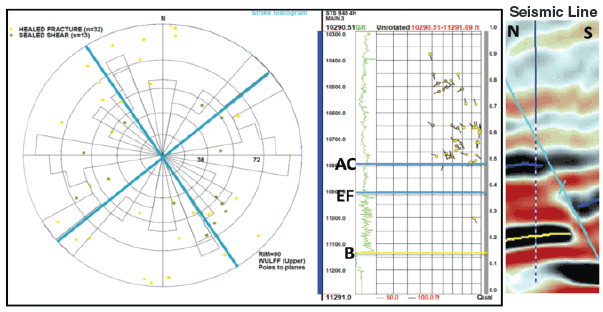
Numerous fractures were observed adjacent to the fault. A majority of them were healed, with extension and shear-type fractures trending in two dominant orientations (strike 60 and 150 degrees) and generally steeply dipping (with three sets of extension fractures dipping greater than 80 degrees, and two conjugate sets of shear fractures dipping 60 degrees).
The dip orientations are shown as light blue lines in Figure 7B. Within the Eagle Ford formation, one clear fracture was observed, interpreted to be healed and oriented 150/88 degrees (dip direction/dip angle), with several other possible fractures of similar and perpendicular orientation also visible. An intersection angle between the borehole and fractures of less than 10 degrees implies that a large amount of correction must be applied to account for the relatively higher expected horizontal fracture frequency/density.
Study Results
The study illustrates how numerous datasets can be analyzed to gain insights into the productivity impact of natural fracture/fault systems and various stress conditions in unconventional reservoir development. A fully integrated, multidisciplinary approach is needed to utilize the diverse datasets, with a continuous emphasis on the geologic context.
Routine operational datasets such as mud gas logging and completions flowback analysis were related to specific structural and stress field environments within the field as delineated by high-resolution 3-D seismic attribute mapping. Buried-array microseismic data and produced gas isotope analysis also strongly conformed to the specific structural settings outlined by attribute mapping. Direct visual identification of fracture types using core and FMI log data confirmed joint orientations and types, and validated seismically resolvable features interpreted from attribute mapping.
The findings confirm that natural fractures and differing stress conditions play a significant role in well productivity in Eagle Ford development in La Salle County. As illustrated in Figure 8, one of the key conclusions is a fracture classification model characterized by three distinct fracture types:
- Class 1, hydraulically induced fractures;
- Class 2, stratigraphically bound/confined natural fractures, and;
- Class 3, unconfined and non-stratigraphically-bound or out-of-zone natural fractures.
FIGURE 8
Fracture Classification Model
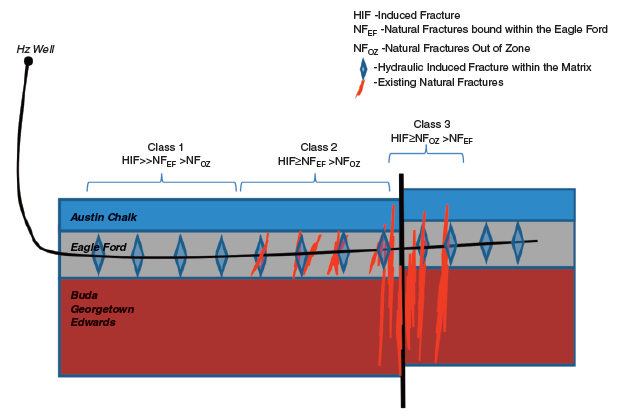
Class 1 fractures encompass a region where hydraulically induced fractures constitute the dominant fracture type, with natural fractures having little to no effect.
Class 2 denotes areas where stratigraphically bound fractures constitute a discernable portion of the SRV and interact constructively with induced fractures. Class 2 regions are prone to yield the best production results. This is attributed largely to the increased fracture surface area attained either by hydraulically induced fractures interacting with stratigraphically bound/confined natural fractures, or by altering the stress regime (in favor of a low stress bias) in structural environments such as relay ramp structures to make the rock matrix more susceptible to forming complex fracture networks.
In contrast, class 3 regions are prone to yield poor production performance. Non-stratigraphically-bound fractures within a given portion of the SRV result in negative production effects. Fracturing energy is transferred through the fault displacement and diverted away from the target zone, thereby leaving substantial amounts of reservoir volume under- or unstimulated.
As the study explicitly suggests, not all pre-existing structural geologic features are created equal. Discerning their differences, occurrences and proportions within a given wellbore path and field is imperative to productivity. These learnings are critical in delineating sweet spots, and ultimately, optimizing full-field development planning in the La Salle County field area.
Editor’s Note: For more detailed information on the results of the Eagle Ford study, see URTeC 2148347, Investigating Natural Fracture Effects on Well Productivity: Eagle Ford, La Salle County, Tx, a technical paper presented at the 2015 Unconventional Resources Technology Conference, held July 20-22 in San Antonio.
PAOLO GROSSI is a geologist on the Eagle Ford asset team at Talisman Energy USA Inc., a part of Repsol. Grossi is part of the multidisciplinary team responsible for developing approximately 60,000 net acres of Talisman (Repsol)-operated Eagle Ford assets in La Salle and McMullen counties, Tx. He began his career with Talisman Energy in Calgary in 2007, and his professional focus has been on the exploration, appraisal and development of unconventional resources, including deep basin tight gas in Canada, as well as U.S. and international oil and gas shale projects. Grossi holds a B.S. in petroleum geology from the University of Calgary.
For other great articles about exploration, drilling, completions and production, subscribe to The American Oil & Gas Reporter and bookmark www.aogr.com.