


Drilling Outlook
Resilient Operators Anticipate Rebound And Recovery
By Bill Campbell
According to Webster’s New World College Dictionary, to be resilient means having the capability to “recover strength, spirits, good humor, etc., quickly.”
Right next to the word is a picture of an independent oil and gas producer.
Not really. But maybe there should be.
Despite enduring arguably the worst year the industry has experienced since 1986, U.S. independents stand ready to pick up the pace of their drilling activity in 2016, according to The American Oil & Gas Reporter’s annual Survey of Independent Operators.
AOGR mails its Survey of Independent Operators to producers nationwide selected at random from the magazine’s subscription list. No attempt is made to identify survey respondents, and AOGR staff compile and analyze the data.
Respondents to the 2016 survey say they anticipate increasing this year’s drilling activity by 6.4 percent compared with 2015. More active drillers (category 2)–those who plan to drill six or more wells this year–are most positive, projecting a 9.4 percent increase over 2015 (Figure 1). Less active drillers (category 1)–those who expect to drill 0-5 wells this year–are less upbeat, predicting a 1.7 percent decline in total drilling.
FIGURE 1
Change in Operators’ Planned 2016 Drilling
Compared with 2015 Actual Drilling
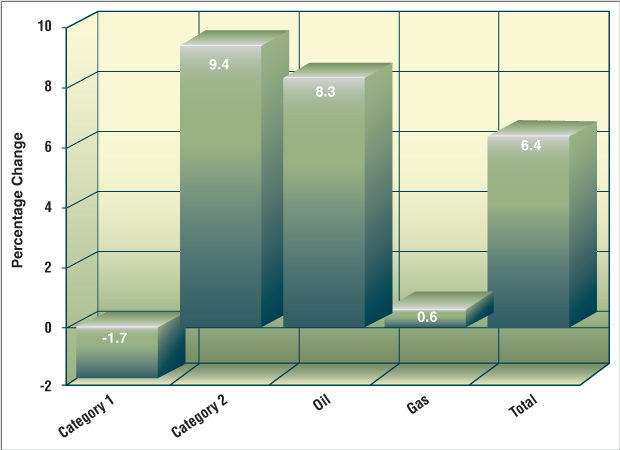
Category 1 respondents are those that plan to drill between zero and five wells in 2016. Category 2 respondents will drill six or more wells in 2016. Respondents included in the “oil” category targeted crude oil on more than 50 percent of their 2015 wells, while “gas” drillers targeted natural gas on at least half of their 2015 wells.
Those who targeted crude oil on more than half their wells in 2015 are more positive than those who directed at least half their 2015 wells toward natural gas. “Oil” category drillers project an 8.3 percent increase in 2016 drilling, compared with a 0.6 percent increase by “gas” category drillers.
The Survey of Independent Operators does not account for dry holes, and merely asks whether a well, when it is spudded, is targeting primarily conventional crude oil, conventional natural gas, unconventional crude oil, unconventional dry gas, or unconventional wet gas.
It should be noted that because its recipients are selected randomly, the Survey of Independent Operators tends to be weighted toward the preponderance of small companies that comprise the majority of the U.S. independent oil and gas operator universe. The average respondent drilled 5.6 wells in 2015. Of those, 68.9 percent were drilled to conventional formations, and 70.5 percent were traditional vertical wellbores.
At What Price?
The caveat to the Survey of Independent Operators is the $100 million question facing the worldwide petroleum industry: At what price?
AOGR’s survey was conducted between Nov. 9 and Nov. 20, when crude oil prices (West Texas Intermediate spot at Cushing, Ok.) ranged between a high of $44.23 and a low of $39.39 a barrel. The Henry Hub natural gas futures price moved between a high of $2.39 an Mcf and a low of $2.15 an Mcf. Survey respondents based their 2016 drilling plans on the expectation oil prices would recover to $54.17 a barrel and gas prices would rise to $2.86 an Mcf.
How reasonable that expectation is may depend on whom one asks. Solidly in the “lower for longer” camp is Moody’s Investor’s Service, which in a mid-December report, predicted WTI crude would average $40 a barrel this year, $45 a barrel in 2017, and $50 in 2018. Moody’s gas price projections are $2.25 an MMBtu this year, $2.50 in 2017 and $2.75 in 2018.
In writing on the Organization of Petroleum Exporting Countries’ December ministerial meeting, Oil Daily cites a Goldman Sachs projection for $45 WTI in 2016.
Oil Daily also quotes Sanford Bernstein analysts projecting $2.75 an Mcf natural gas prices in 2016, $3.00 in 2017 and $3.25 in 2018. In a shorter-term outlook, Societe Generale forecasts Henry Hub prices won’t rise above $2.30 in the first quarter of this year, then will creep to $2.45 an MMBtu in the second quarter, $3.05 in the third quarter, and $3.45 in the fourth quarter.
A Raymond James analyst told the Independent Petroleum Association of America’s 2015 Fall Supply & Demand Committee meeting in November he expected WTI to average $55 in 2016 and $70 between 2017 and 2020, and Michael Cohen, director and head of energy commodities research at Barclays in New York, predicts $56 WTI this year (see story page 34).
The U.S. Energy Information Administration’s Short-Term Energy Outlook for December has WTI spot prices averaging $45.61 a barrel in the first quarter of this year before rising to $54.00 a barrel by the third quarter, then dipping to $52.33 in the fourth quarter as production begins to rise again. EIA projects Henry Hub gas prices will increase steadily from $2.36 an MMBtu in fourth quarter 2015 to $3.27 in fourth quarter 2016.
Kent Moors is a consultant and professor in the Graduate Center for Social and Public Policy at Duquesne University, where he directs the Energy Policy Research Group. Moors makes investment recommendations in various newsletters, including the Energy Advantage and his e-letter, Oil & Energy Investor, where he writes, “By July 1, WTI should be at $66. By Oct. 1, WTI will be at $68, and by Jan. 1, 2017, WTI should finally breach $70 a barrel.”
And then there is Michael LaMotte, senior managing director at Guggenheim Securities, who made a market-moving call on Dec. 7 by upgrading 23 oil field service stocks to “buy” rating. In a note to clients posted on oilpro.com, LaMotte states, “We believe the global oil market will begin to tighten in second quarter 2016, and that oil prices will rise farther and faster than the lower-for-longer consensus expects, reaching $100 a barrel by 2018.”
LaMotte explains his reasoning in a CNBC interview also posted on oilpro.com, in which he says, “From 2010 to 2014, it took almost $1 trillion and five years of $90+ oil to get oil (production) growth from 100,000 to 1.0 million barrels a day in the United States. Our supply/demand balance has a call on the U.S. resource of 1.0 MMbbl/d again in 2019, and I think three years is just too fast and $50 is not a high enough price to get that kind of capital deployed again.”
Setting The Stage
The emerging expectation for a sharp rebound in the second half of 2016 is detailed in Evercore ISI’s Global E&P Spending Outlook, released Dec. 8, for which Evercore “had discussions with or analyzed financial and strategic documents for almost 300 oil and gas companies.”
In it, Evercore acknowledges a 31 percent drop in the U.S. exploration, drilling and production sector’s 2015 capital expenditures, and predicts another 20 percent pullback in 2016. However, despite this near-term pain, Evercore writes, “We believe these conditions ultimately will cleanse the oil patch and set the stage for a sustained upcycle. We anticipate significant capital investment revisions to unfold in 2016 . . . particularly if commodity prices strengthen as we anticipate by the middle of the year.
“It always looks the worst at the bottom of the capex cycle, which we are approaching,” Evercore continues. “Once the market has visibility on this capital spending bottom, the recovery comes into view. We believe capex will bottom in fourth quarter 2015/first quarter 2016, and we expect this recovery will be similar to others: North America will rebound first and the strongest.”
Part of its reasoning, Evercore outlines, is the favorable hedges with which many large operators entered 2015. It estimates some operators had half their production hedged at $90 a barrel, “allowing them to increase their realized price for oil by almost $20 a barrel through third quarter 2015. Looking to 2016, this trend should subside as hedges continue to roll off. On average, operators hedged 41 percent of their 2015 production; for 2016 that number falls to 24 percent.”
Price Sensitivity
Evercore’s own price projection for the average barrel of WTI this year is $60, but it says the companies in its survey budgeted on an average of $47.60 a barrel. Evercore says the average price that would prompt higher spending is $63 a barrel, and it adds, “Nearly 60 percent of respondents note they would increase budgets if oil prices reach levels between $60 and $65, with one-third citing $65 as the price that will spur additional investment.”
FIGURE 2A
Crude Oil Prices at Which Operators
Would Alter 2016 Drilling Plans
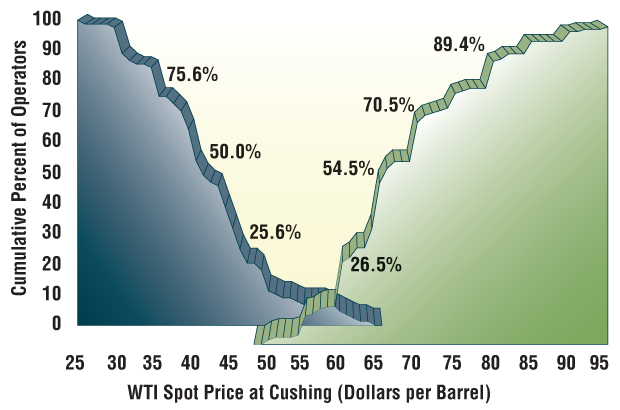
FIGURE 2B
Natural Gas Price at Which Operators
Would Alter 2016 Drilling Plans
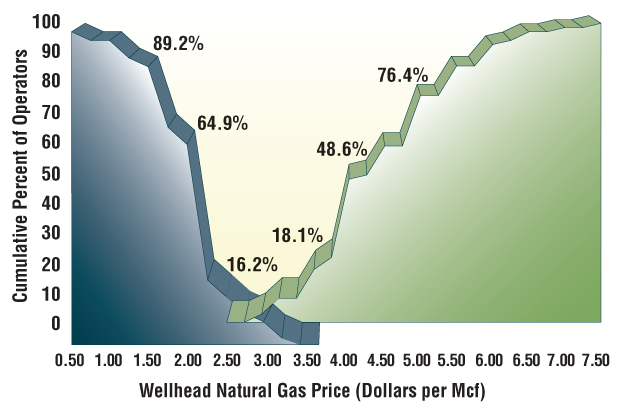
Percentages in Figures 2A and 2B represent the cumulative total of survey respondents that indicate they would have altered their 2016 drilling plans by the time the spot price for West Texas Intermediate crude oil delivered at Cushing, Ok. (Figure 2A), or the wellhead natural gas price (Figure 2B) reached the indicated amount. Prices at which drilling would decrease are plotted to the left of the graphs in downward curves; prices at which drilling would increase are plotted to the right of the graphs in upward curves.
This compares with the Survey of Independent Operators, in which 26.5 percent of respondents indicate they would increase their 2016 drilling plans at a WTI price of $60 a barrel (Figure 2A). That number jumps to 54.5 percent who would drill more wells at $65 a barrel, 70.5 percent who would increase drilling at $70 a barrel, and 89.4 percent who would drill more at $80.
Conversely, Evercore reports more than half of the companies it surveyed would decrease spending at $40.00 a barrel WTI, while an additional 28 percent would back off below that level.
About a fourth of respondents to AOGR’s survey say they will dial back their drilling plans at $47.00 a barrel. That grows to exactly half at $42.00 and reaches three-quarters at $37.00
For natural gas, Evercore says its companies budgeted for a 2016 average price of $2.63 an MMBtu. It reports 34 percent will increase their capital outlays if prices reach $3.25 an MMBtu, and three-quarters will spend more by the time gas prices rise to $3.75. On the downside, Evercore reports 24 percent will cut back at $2.25 an MMBtu, rising to 82 percent at $2.00.
The Survey of Independent Operators shows drilling plans starting to tick upward between $3.50 and $3.75 an Mcf, where a cumulative 22.2 percent of respondents say they would drill more wells (Figure 2B). That jumps to 48.6 percent at $4.00 and to 76.4 percent at $5.00. Going the other way, only 21.6 percent of AOGR survey respondents would decrease gas drilling at a price of $2.25 an Mcf, but that spikes to a whopping 64.9 percent at $2.00 and 89.2 percent at $1.50.
Oil And Gas Production
Since OPEC chose in November 2014 to defend market share rather than crude oil prices, the burning question has been how soon and by how much would lower prices affect U.S. production, which arguably has proven much more resilient than OPEC and many analysts anticipated.
By year-end, however, there were strong signals the slowdown had begun. In its Weekly Petroleum Status Report for the week ended Dec. 4, EIA reported total domestic production of 9.164 MMbbl/d, 38,000 bbl/d less than the week before and 434,000 bbl/d less than the April 2015 peak.
EIA’s Short-Term Energy Outlook for December anticipates U.S. crude oil production will continue to decline to an average of 8.95 MMbbl/d in first quarter 2016, on down to 8.80 MMbbl/d and 8.56 MMbbl/d for the second and third quarters, respectively, before rebounding to 8.75 MMbbl/d in fourth quarter 2016.
For the first time this year, the Survey of Independent Operators asked respondents how their first quarter 2016 oil and gas production would compare with first quarter 2015. The answer was 6.2 percent less crude oil and 7.7 percent less natural gas.
That response compares favorably with EIA’s calculation that first quarter 2016 crude oil production will be 4.7 percent less than first quarter 2015’s 9.37 MMbbl/d, but is counter to EIA’s natural gas calculations putting first quarter 2016 dry gas production at 75.93 billion cubic feet a day, 3.1 percent above first quarter 2015’s 73.67 Bcf/d. EIA projects U.S. gas production will continue to rise throughout 2016 to an annual average of 76.26 Bcf/d.
FIGURE 3
Change in 1Q2016 Oil & Gas Production
Compared with 1Q2015
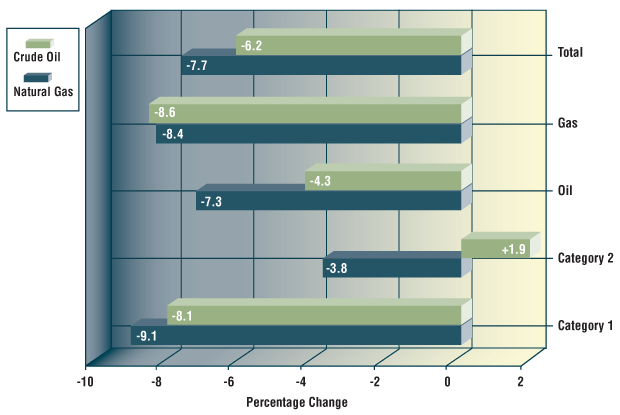
Category 1 respondents are those that plan to drill between zero and five wells in 2016. Category 2 respondents will drill six or more wells in 2016. Respondents included in the “oil” category targeted crude oil on more than 50 percent of their 2015 wells, while “gas” drillers targeted natural gas on at least half of their 2015 wells.
In AOGR’s survey, category 1 (least active) drillers projected the largest crude oil and natural gas production drops of 8.1 and 9.1 percent, respectively (see Figure 3). Category 2 drillers report a 1.9 percent increase in first quarter oil production year over year, and a 3.8 percent drop in natural gas production.
BDO USA LLP doesn’t measure volumetric changes in oil and gas production in its 2016 Energy Outlook Survey, for which it interviews chief financial officers at 100 U.S. oil and gas exploration and production firms. But it does report that 43 percent of the CFOs it spoke with expect the domestic supply of oil to decrease in 2016, while 22 percent expect it to stay the same.
BDO adds that 10 percent of its CFOs expect the domestic supply of natural gas to decrease this year, while 50 percent expect it to remain the same. BDO also mentions that 53 percent of the CFOs it interviewed say their companies significantly delayed or terminated oil or gas exploration or processing projects over the previous 12 months.
In AOGR’s survey, 64 percent of respondents said their 2016 crude oil production would be down, 22 percent said it would remain the same, and 23 percent said it would increase. For natural gas production, the numbers are 69 percent down, 31 percent the same, and 6 percent up.
Elsewhere, Jodi Quinnell, manager of crude oil analytics at Boston-based Genscape Inc., says her company expects an 800,000 bbl/d decline in U.S. crude oil production by year-end.
News service Bloomberg quotes ConocoPhillips Chairman and Chief Executive Officer Ryan Lance telling an early December conference in Qatar that he expects U.S. production to drop 500,000 bbl/d this year. And in an interview with investor Carl Icahn posted on www.profitconfidential.com, legendary oilman T. Boone Pickens explains why he expects an industry rebound in the second half of 2016: “When you went from 1,609 rigs to 514, that took half a million barrels (a day) off of 9.6 MMbbl/d. In another six months, you are going to take another half million barrels off.”
For other great articles about exploration, drilling, completions and production, subscribe to The American Oil & Gas Reporter and bookmark www.aogr.com.