


Natural Gas Hedging
Analytical Tools Mitigate Gas Price Risks
By Andrew D. Weissman
WASHINGTON–For the North American natural gas industry, 2014 has generally been a good year. Due in part to record space heating demand last winter, Henry Hub prices since Jan. 1 have averaged $4.59 per MMBtu–25 percent higher than during the same period in 2013 and 85 percent above 2012.
FIGURE 1
Winter Space Heating Demand (Bcf) and
Natural Gas Prices ($/MMBtu)
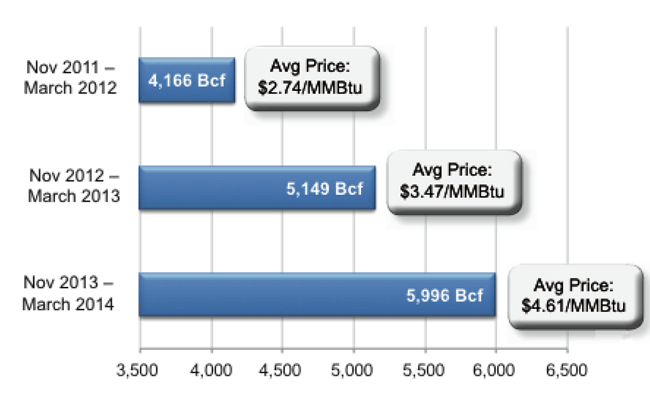
Source: EBW AnalyticsGroup
Figure 1 shows space heating demand in billions of cubic feet and natural gas prices over the past three winters, while Figure 2 shows New York Mercantile Exchange front-month natural gas contract prices since January 2012. Not surprisingly, gas prices have been much stronger over the past two winters in correlation to increased heating demand.
FIGURE 2
NYMEX Front-Month Contract Prices ($/MMBtu)
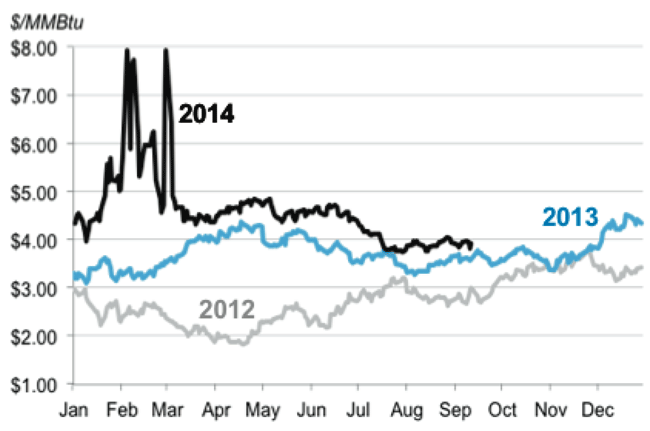
Source: EBW AnalyticsGroup, Bloomberg
With natural gas development costs continuing to decline, margins have been stronger than in the previous two years. Furthermore, by following a more disciplined approach to capital expenditures, producers have been able to strengthen their balance sheets considerably. Next year, on an industrywide aggregate basis, cash flow from operations is expected to exceed capital spending for the first time since 2008, leaving the industry well positioned for future growth.
And the good news doesn’t end there. The future burns bright for domestic natural gas producers. During the past year, it has become increasingly apparent that U.S. demand for natural gas is likely to grow explosively by the end of decade. This expected surge is the result of four major developments, all of which are likely to come to a head at about the same time:
- A tsunami of liquefied natural gas exports from the United States to overseas markets, with daily U.S. LNG export volumes forecast to reach 12 Bcf-15 Bcf by the end of the decade;
- The shut-down of up to 25 percent of current U.S. coal-fired electricity generation capacity, with much of the lost output replaced by the increased use of natural gas;
- A potential two- to three-fold increase in pipeline exports to Mexico, which are likely to grow more rapidly than LNG exports until late in the decade; and
- A major surge in industrial consumption of natural gas, particularly along the Gulf Coast.
FIGURE 3
Potential Demand Increases for
U.S. Natural Gas (2015-20)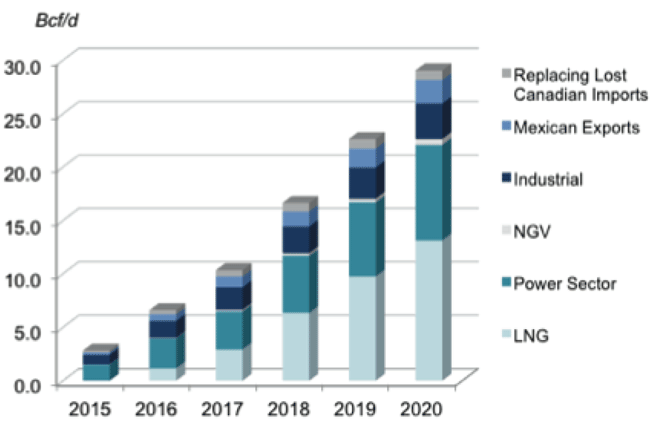
Source: EBW AnalyticsGroup
The projected demand increases shown in Figure 3 are not yet locked in. It is still possible, for example, that opponents of LNG exports will succeed in blocking export projects in the U.S. court system, which would be a major blow to the natural gas industry. However, the most likely scenario is that demand for natural gas will increase by more than 20 Bcf/d by 2020, bringing total daily U.S. demand to as much as 90 Bcf-95 Bcf. This increase could be as much as 5 Bcf-10 Bcf/d higher if the U.S. Environmental Protection Agency decides to implement tough new federal restrictions on carbon dioxide power plant emissions, as proposed in June.
By the end of the decade, therefore, the full promise of the “shale revolution” may finally be realized.
Near-Term Challenges
Even with all the future promise, there are still perilous waters to navigate over the next three to four years, however. It is important to be crystal clear on this point: Demand will not start to skyrocket until the tail end of the decade, post-2017. In the interim, much will depend on weather. Unless weather-driven demand for natural gas is consistently much stronger than normal for three straight years, prices for natural gas are likely to come under considerable downward pressure. While prices at Henry Hub are unlikely to fall to the distressed levels seen in 2012, basis differentials in the Northeast region will probably remain high for all or most of this period. Furthermore, the prospects of the NYMEX strip continuing to trade above $4.00 an MMBtu on a sustained basis are not very high. Instead, there is much greater risk than is generally recognized that 2015-17 prices at Henry Hub will fall to the mid-to-low $3.00 per MMBtu range, or 10-25 percent below mid-September levels of $4.00-$4.25 per MMBtu.
Even at prices at the low end of this range ($3.00-$3.25 per MMBtu), most producers are sufficiently well hedged for 2015 to be able to make it through the next year without experiencing serious difficulties. The timing of decisions to lock-in prices for remaining 2015 production could prove to be important, with cash flows for producers who mistime the market falling significantly below projected levels. Moreover, decisions regarding when to hedge 2016 and 2017 exposures could prove to be even more critical.
Accurate Market Analysis
In this low-price environment, the accuracy of price forecasts and the timing of hedging decisions will be even more important to each company’s success than in the past. Many producers were hurt badly when prices plummeted in the first few months of 2012. While the potential price decline is not as severe this year, it is critical that the industry not be taken by surprise again, as the carnage that occurred in 2012 demonstrated.
In our view, to protect against downside risks, it is not necessary to fully hedge 2015-17 production immediately. Instead, with many meteorologists predicting another cold winter, there is a substantial possibility that prices will increase between mid-September and the start of winter, even if current forecasts prove to be overly bullish. The potential for further gains is fueled, in part, by hopes for a repeat of last winter’s price explosion, which briefly drove Henry Hub prices to $8.00 an MMBtu.
FIGURE 4
U.S. Onshore Natural Gas Production
(Sept. 2013-Sept. 2014)
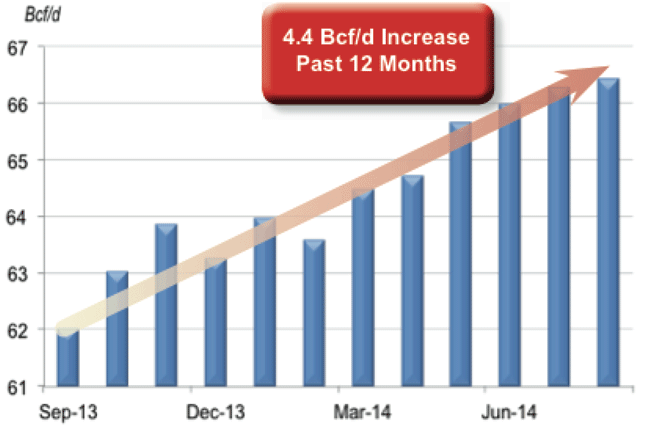
Source: EBW AnalyticsGroup, EIA
However, most forecasts are already assuming a colder-than-normal winter scenario (i.e., close to a “best-case” scenario). These forecasts could prove to be too bullish.
Furthermore, U.S. production is continuing to escalate at a ferocious rate, with a 4.4 Bcf/d year-over-year increase over the past 12 months for which the U.S. Energy Information Administration (EIA) has published data (Figure 4). If anything, as productivity continues to prove, growth in the U.S. production rate could accelerate over the next 12 months.
In an increasingly oversupplied market, even if last year’s exceptionally severe winter were to be repeated, prices are unlikely to continue escalating through the heart of the winter, as they did in January and February of 2014. Instead, even if bullish weather forecasts validate, the far-more likely scenario is that prices will peak early in the winter.
Moreover, forecasts could shift warmer at any time. Once this occurs, prices could start to drop rapidly, and continue to decline in winter and early spring, dropping well below today’s forward curve (the extent of this decline will depend heavily on winter weather, which cannot yet be predicted with any confidence).
To achieve acceptable earnings and preserve cash flow over the next three years, producers will need to be prepared to pull the trigger quickly when attractive hedging opportunities arise and hedge a larger share of their production than has historically been typical for most companies.
To accomplish this, producers need to utilize a new set of analytical tools that enables them to assess market conditions with greater confidence than in the past. In particular, producers must be able to:
- More accurately assess the supply/demand balance, including the supply side of the equation in particular;
- Develop the capability to more accurately assess weather-related risks; and
- Accurately assess the potential impact of higher-than-expected supply and deviations from normal weather on the market-clearing price of natural gas.
New Analytical Tools
Without getting into too much detail about the new analytical tools now available to producers, there are three significant points that must be emphasized in explaining why it is so crucial for producers to apply these new capabilities to manage price risk.
First, industry analysts are significantly underestimating likely growth in U.S. natural gas production. As we have discussed in previous issues of The American Oil & Gas Reporter, some of the most widely followed forecasters continue to make serious mistakes in estimating ongoing domestic production growth–a potentially fatal mistake.
Production efficiencies have improved significantly every year since the shale revolution began. This trend is nearly certain to continue for the next several years. While vulnerable to criticism in certain respects, EIA’s estimates of growth in production per rig in the Marcellus Shale give an accurate picture of the overall trend (Figure 5).
FIGURE 5
Marcellus Shale Natural Gas Production per Rig and Rig Count Since 2010
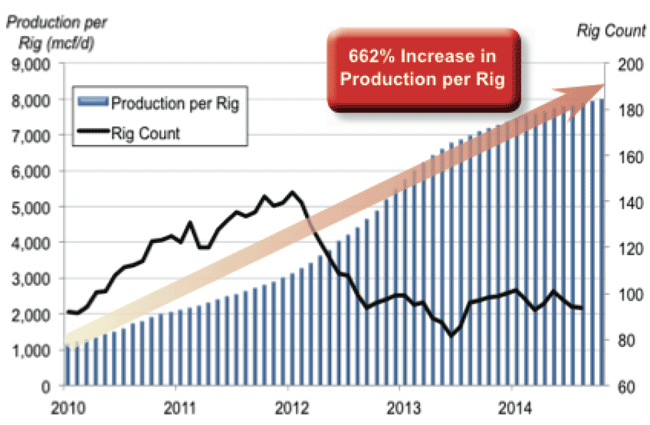
Source: EBW AnalyticsGroup, EIA
FIGURE 6
Marcellus and Utica Shale Natural Gas Production Since 2010
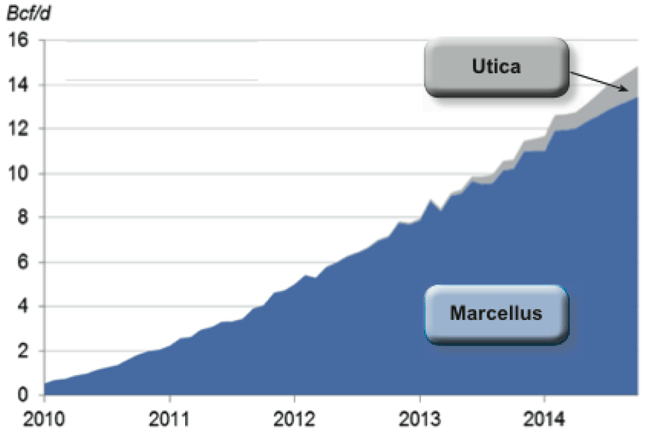
Source: EBW AnalyticsGroup, EIA
A host of improvements (e.g., more experience drilling in specific plays, longer laterals, more powerful fit-for-purpose rigs, more fracture stages, more effective use of proppants, switching to pad drilling, dramatic reductions in spud-to-spud drilling times, etc.) has led to per-well productivity increasing nearly eight-fold over the past five years, and more than 60 percent since the beginning of last year. As a result, production in the Marcellus and Utica shales has expanded at a jaw-dropping rate (Figure 6) at the same time that costs per unit of production have declined rapidly.
As regional pipeline bottlenecks are overcome, total production for the two plays combined is likely to continue increasing at a rate of 3.5 Bcf/d-4.0 Bcf/d per year for much of the remainder of the decade.
Prior to this year, these increases were partially offset by rapid declines in production from the Haynesville Shale. However, with continued efficiency improvements and cost declines, Haynesville gas production has now plateaued. In addition, production in the remainder of the United States also is likely to increase slightly on a net overall basis, in part because of associated gas production in Eagle Ford Shale and Permian Basin oil plays. Therefore, if anything, growth in production over the next 12 months could exceed EIA’s 4.4 Bcf/d estimate.
In the name of “conservatism,” highly regarded engineering firms continue to rely on backward-looking assumptions regarding development time and costs that fail to take into account improvements that are already being demonstrated in the field. The inevitable result is that, year-over-year, many published production projections underestimate growth to the detriment of every producer who relies on these forecasts.
During the past twelve months, the impact of these flawed estimates has been masked by one of the coldest winters in years. In a normal-weather scenario, however, the U.S. market would have been oversupplied by more than 750 Bcf/d. Rather than producers enjoying an average year-to-date price of $4.59 an MMBtu, prices more likely would have averaged $3.40-3.45 per MMBtu (Figure 7).
FIGURE 7
Market-Clearing Natural Gas Prices under
Normal-Weather Scenario Since 2011
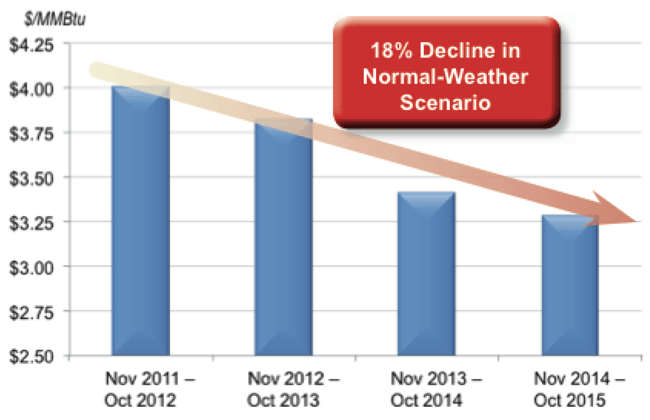
Source: EBW AnalyticsGroup
As production continues to grow, the oversupply condition in the market is likely to become even more severe, potentially reaching 1 Tcf in 2015. Even in a normal-weather scenario, the market-clearing price would likely average close to $3.30 an MMBtu, which would be far below the current forward curve. If weather is milder-than-normal (an entirely plausible scenario), prices could fall even farther.
For producers to make sound hedging decisions, it is imperative that this flaw in projecting growth in demand be corrected.
Outdated Methodology
In recent years, swings in weather have had a dramatic impact on prices for natural gas. This is partly because the frequency of extreme weather events has been increasing, but it is also because natural gas-fired generation is now the incremental source of electricity supply in nearly every region. The number of natural gas-heated homes has also been increasing every year. As a result, huge shifts in weather-driven demand for natural gas have become more the rule than the exception.
Therefore, it is no longer possible to properly evaluate the natural gas market without being able to accurately assess weather-related risks. That leads to a second key point: The methodology used by most weather forecasters is outdated.
In fact, the performance of many weather forecasting firms has been disappointing. In recent years, producers have been blindsided by weather conditions that turned out to be the exact opposite of most forecasters’ predictions. More than once (as in 2012), the consequences to the industry have been devastating, with prices plunging to levels no one in the industry anticipated.
This does not have to continue. Uncertainty in weather forecasting can never be eliminated; the dynamics of the atmosphere are too complex. However, it is possible to develop a much more reliable basis for decision making by using advanced forecasting techniques and applying a verified, scientifically valid approach.
Many meteorologists use a forecasting approach that suffers from two major shortcomings. First, many meteorologists rely on an outdated methodology that depends almost exclusively on progression models that attempt to simulate expected development in the atmosphere, and the use of historical analogs. But progression models are inherently limited tools. Even a single error in the initial conditions specified in running the model can lead to huge forecast errors, potentially even in the first seven to 10 days covered by the modeling run. The likelihood of errors is even greater further out in time.
The historical analogs used by many forecasters also are often only of limited applicability because they fail to fully take into account differences in the physical conditions in the atmosphere and identifiable long-term atmospheric trends. To utilize progression models properly, it is necessary to apply the models within a broader framework, which many meteorologists fail to do.
FIGURE 8
Winter 2013-14 Weather Forecasts
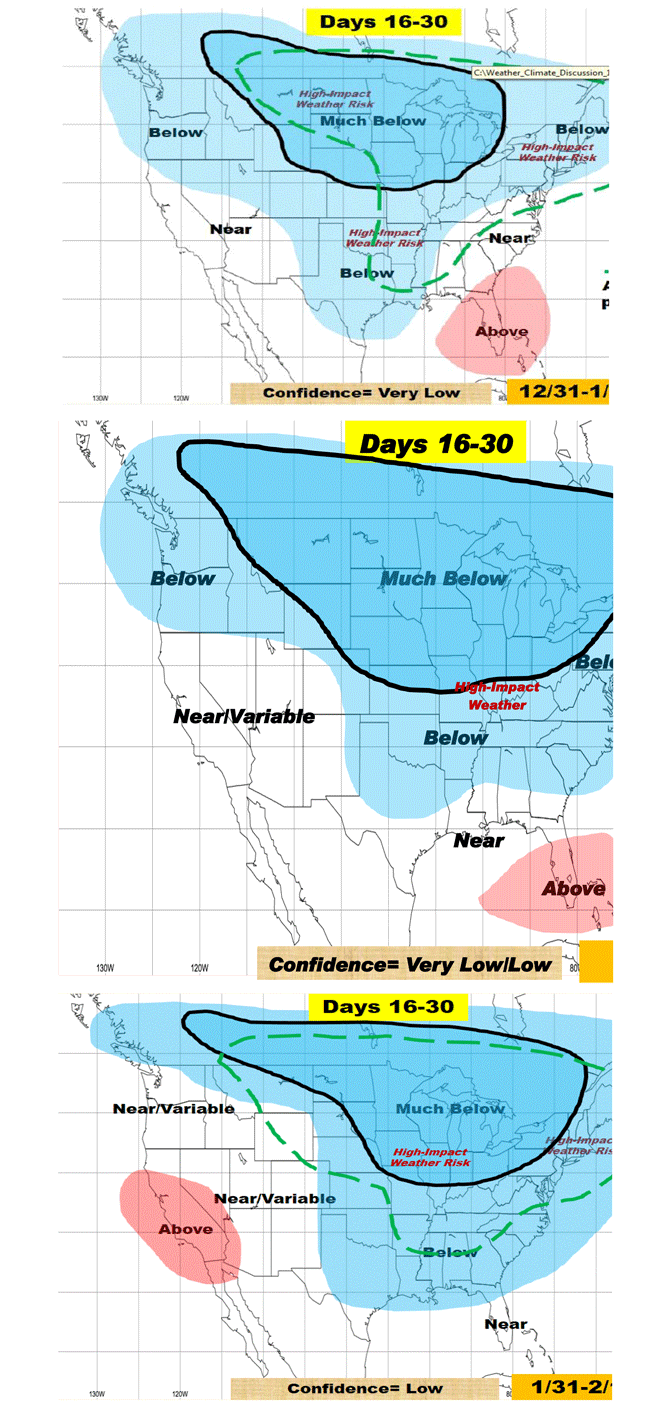
Source: Weather Decision Technologies Inc.
Furthermore, many meteorologists focus only on developing a “most likely” forecast without attempting to specifically identify or quantify the risk of a materially different outcome. This is a serious mistake, and it explains precisely why producers are often blindsided. In many instances, the likelihood of the “most likely” forecast validating may be as little as 20 or 30 percent.
To make intelligent decisions, producers must be provided with a rigorous analysis of alternative scenarios and the probability that these scenarios will occur.
This dependence on a flawed approach to weather forecasting is not necessary. At least some forecasting firms, such as Weather Decision Technologies Inc. (WDT) in Norman, Ok., employ a more sophisticated approach. Using next-generation forecasting techniques, WDT was able to identify the potential for continuing bitter cold weather last winter much earlier than many other forecasters, as illustrated by the maps in Figure 8.
More Intelligent Decisions
The final take-away point is that the price impacts of increased production and swings in weather can be calibrated with precision. There is no need to guess as to how variances in production or weather could influence natural gas prices. With next-generation analytical tools, it is usually possible to predict where prices will move within $0.05/MMBtu under any given set of weather assumptions.
This does not mean that hedging decisions can be made mechanically. Instead, even weather forecasters using the most advanced techniques available can only predict a range of probabilities regarding future weather conditions, especially as forecasts move farther out in time.
Armed with the best analytical tools available, however, it is often possible for producers to identify potential shifts in weather well before they occur and to assess accurately the potential impact these shifts will have on natural gas prices.
Using this information, producers can make more intelligent decisions regarding the potential upside and downside risks of delaying hedges, and determine with greater confidence when it is appropriate to act. This capability is important even when markets are robust, but it is particularly critical at times when downside price risks are much greater than normal.
With advanced analytical tools, producers can successfully overcome the potential challenges facing the industry over the next three years, and put themselves in a strong position to take full advantage of the tremendous opportunities that will emerge down the road.

Andrew D. Weissman is senior energy advisor at Haynes and Boone LLP, and chief executive officer and founder of EBW AnalyticsGroup, an energy market analysis service. During his 35-year career, Weissman has provided strategic advice and counseling to independent oil and gas producers, power producers, major electric and gas utilities, hedge funds and energy traders, retail and wholesale energy marketers, equipment vendors, and large energy users, typically at the chief executive officer level. He also has played a key role in developing innovative new business structures and helping to transform energy and environmental policy at the state and federal levels. Weissman helped pioneer the use of emissions trading in the United States, structuring nearly all of the early transactions, and has been actively involved in the effort to replace coal-fired electric generation with natural gas-fired generation.
For other great articles about exploration, drilling, completions and production, subscribe to The American Oil & Gas Reporter and bookmark www.aogr.com.