


Gas Market Update
Appalachia Driving U.S. Production Growth
WASHINGTON–For the fourth consecutive month, September’s U.S. dry natural gas production increased year-to-year, averaging 75.0 billion cubic feet a day. Although down slightly from August, the monthly total was up 3.1 Bcf/d from September 2016, and was the highest September level since the U.S. Energy Information Administration began tracking monthly dry production in 1973, the agency reports.
The Appalachian Basin is the key driver in U.S. production growth. According to EIA data, Appalachian gas production jumped by more than 8.0 billion cubic a day between the end of the third quarter of 2015 and the end of third-quarter 2017. In September, regional production increased by 350 million cubic feet a day from August to total 24.6 Bcf/d–nearly three times the daily output in the Permian Basin for the month, and almost four times the daily volumes in the Haynesville Shale.
For the full year, EIA says Appalachian production averaged 23.8 Bcf/d (through October). The average production for wells drilled in the basin in September was 14.2 MMcf/d a rig, an increase of more than 10.8 MMcf/d per rig/new well since 2012 (Figure 1). EIA says it attributes this increase to efficiency improvements in horizontal drilling and hydraulic fracturing, including faster drilling, longer laterals, technology advances, and better targeting of wells.
FIGURE 1
Average New Well Gas Production Per Rig (MMcf/d)
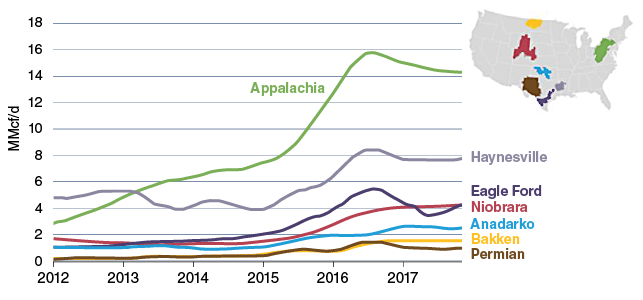
Source: U.S. Energy Information Administration.
For example, in West Virginia, EIA reports that the average lateral length had increased to more than 7,000 feet per well by 2016, with some operators drilling laterals as long as 15,000 feet in the Marcellus Shale and 19,000 feet in the Utica. Along with longer horizontal drilling, the number of days required to complete a well has decreased markedly, from 30 days in 2011 to seven days by 2015.
As of November, Marcellus operators drilled more than 11,300 wells, and more than 1,800 wells drilled in the Utica-Point Pleasant play, according to EIA. To accommodate the surging production, the agency says natural gas processing capacity in Kentucky, Ohio, Pennsylvania and West Virginia has expanded 10-fold, and is projected to continue increasing by 2.5 Bcf/d over the next few years. EIA estimates that regional fractionation capacity could reach 1.1 MMbbl/d in 2019 (a 40 percent increase from 2016) and de-ethanization capacity is on pace to reach 350,000 bbl/d by 2019 (a 75 percent increase from 2016).
Power Sector Demand
The electricity generation sector is one of the key growth markets for Appalachian gas production. Natural gas has surpassed coal as the dominant fuel source in total U.S. power generation, led by the South, which EIA says was the first regional power market to consume more natural gas than coal.
Coal’s share of total electricity generation in southern states declined from 50 percent in 2006 to 29 percent in 2016, according to EIA. As regional coal demand has declined, natural gas usage in power generation has increased–capturing 42 percent of the total electricity generation market in the southern states in 2016.
“That is a bigger share than the U.S. average of 34 percent,” EIA points out in a new report. “At the state level, natural gas makes up as much as 89 percent of in-state electricity generation in Delaware to as little as 2 percent in West Virginia.”
FIGURE 2
Natural Gas versus Coal-Fired Electricity Generation by Market Division (billion megawatt hours)
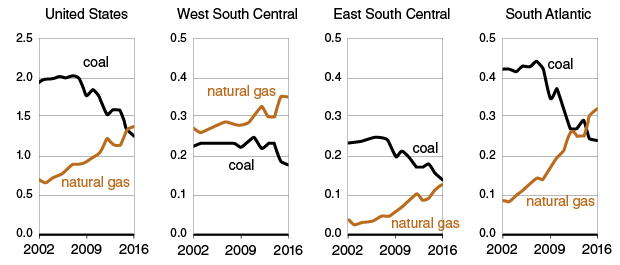
Source: U.S. Energy Information Administration,
Figure 2 shows the shares of natural gas used for electric generation within the southern power market census divisions. In the West South-Central census division (Arkansas, Louisiana, Oklahoma and Texas), natural gas has dominated coal for more than a decade, EIA observes. In the East South-Central division (Alabama, Kentucky, Mississippi and Tennessee), coal-fired electricity generation remains higher than natural gas-fired generation, although the difference has narrowed dramatically over the past few years. In the South Atlantic division (which includes West Virginia, Maryland and Delaware, and extends along the Atlantic coast to Florida), natural gas first surpassed coal in 2015 and continues to expand its market share.
Nearly 21.0 gigawatts of coal-fired generating capacity were taken offline across the South between 2006 and 2016. Although 9.6 gigawatts of new coal-fired capacity were added over that decade, no coal units have been installed since 2013. During the same time, electricity generators installed 47.0 gigawatts of natural gas-fired capacity.
The expanding role of natural gas in the South is a notable case study considering that West Virginia and Kentucky are among the top five U.S. coal mining states, and coal remains the dominant fuel source for electricity generation capacity in both states. Moreover, Texas and Oklahoma rank first and third nationally for installed wind capacity, and the South is home to both the newest nuclear power generator (Watts Bar Unit 2 in Tennessee) and the only nuclear plant still under construction (the Vogtle plant in Georgia). EIA points out that the construction of the proposed V.C. Summer nuclear power plant in South Carolina was canceled earlier this year.
For other great articles about exploration, drilling, completions and production, subscribe to The American Oil & Gas Reporter and bookmark www.aogr.com.