


Development Drilling
Drilling Patterns, Timing Impact NPV
By Vivek Sahai, Greg Jackson and Rakesh Rai
HOUSTON–Capital expenditures, personal and equipment resources, acreage lease restrictions, and market conditions all strongly influence drilling and development schedules in unconventional resource plays. Delaying the start of new wells is understood to reduce the net present value of a section, but how do variations in the timing and drilling pattern of infill wells impact NPV and recovery factors?
To aid operators in understanding the impact of well spacing as shale plays mature from the appraisal to the field development phase, a study was conducted to assess the impact of timing and well placement on NPV and recovery. Drilling schedules were studied to assess the impact of time on asset value and the optimal number of wells drilled. Knowledge of how development decisions impact optimal resource development allows operators to adapt their drilling plans to maximize investment returns.
Three limiting scenarios were evaluated: an infill scheme where future wells were drilled between existing wells, a linear scheme where future wells were immediate offsets of existing wells, and a hybrid scheme that combined the infill and linear approaches. Four start times of future wells were evaluated to determine the impact of timing for three values of matrix permeability.
The study also looked at two different completion schemes: nonstaggered fracture placement, and staggered fracture placement with 25 percent of the stimulated reservoir volume (SRV) “overlapped.” With many operators now developing fields by drilling multiple wells off a single pad to maximize efficiencies and reduce costs, it is becoming more common to overlap hydraulic fractures within the SRV.
The results show that estimated ultimate recovery is relatively insensitive to the drilling schedule, and the section recovery factor can be conserved as long as all the wells are drilled within a reasonable amount of time. However, once a threshold of total cumulative production is achieved from a section, infill wells may not be economic and should be considered carefully.
The numerical reservoir simulations used in the study captured flow from both the SRV encompassed by fractures and the external reservoir volume (XRV) within the drainage volume. The fracture system is the high-conductivity, low-storage portion of the SRV, while the matrix is the low-conductivity, high-storage part of the SRV interspersed within the fracture system. For simplicity, the models assumed biwing planar fractures transverse to the wellbore with same permeability in the SRV and XRV.
Modeling Properties
Average reservoir for the models included:
- 5, 50 and 500 nanodarcy matrix permeabilities;
- 4.8 percent porosity;
- 235-foot pay thickness with the top of pay at 6,875 feet;
- 694 psia Langmuir pressure;
- 57 cubic feet/ton Langmuir volume;
- 0.6 psi/foot pressure gradient;
- 0.57 A gas specific gravity; and
- 640-acre reservoir dimension.
These properties were averaged across 160 wells in a North American shale play. The completed well length of 3,840 feet was the same for all cases, and the lateral was placed in the middle of the pay. The base case had a matrix permeability of 50 nD, a fracture spacing of 80 feet (48 total fractures), and a fracture half-length of 500 feet. The gas production rate for each well in the section was 3,000 Mcf a day.
The optimal wells per section was determined using normalized incremental cumulative recovery, which is defined as the number of wells beyond which any additional well would provide less than 50 percent of the first well’s recovery factor. The optimal number of wells per section for the base case was five wells (1,056 feet between wellbores), as confirmed by a peak in NPV at five wells. All sections were assumed to require five wells for optimal development.
Wells are not drilled simultaneously even on multiwell pads, they are generally not fractured simultaneously (although simultaneous frac operations are increasing), and they are usually not flowed back simultaneously. Several criteria can be used to determine when to bring wells on line: flow regime, fixed points in time, percentage of cumulative gas produced, etc. To compare different timing schemes for drilling wells and bringing them on line, infill, linear and hybrid approaches with perfectly adjacent hydraulic fractures were evaluated based on the quartile gas cumulative midpoint from the numerical model (at 12.5, 37.5, 62.5 and 87.5 percent of total cumulative production). This method mitigates operating conditions that vary by operator, such as the degree to which initial production from new wells is choked back or allowed to flow.
The study’s findings are designed to help operators make critical drilling decisions in resource play development projects. To properly evaluate these decisions, the economics at the moment of the decision are the main factor. Imagine an operator with two wells that have been producing for one year with known drainage areas. Should the operator place a new infill well between them? That decision must be based on the return on the capital required to drill and complete the well, making NPV the key metric.
NPV was calculated using a gas price of $4.00/Mcf, a drilling cost of $2.4 million per well, a fracturing cost of $305,000 per stage, a 3 percent inflation rate, and a 10 percent discount rate. The cost of each well was incurred on the day the well began producing. All NPV values were based on a 20-year production life, despite any delayed onsets of individual wells. The effect of each drilling scheme for each type of completion on NPV was analyzed to help operators maximize investments.
Timing Schemes
FIGURE 1
Infill Timing Scheme with Infill Wells Drilled Between Existing Producers
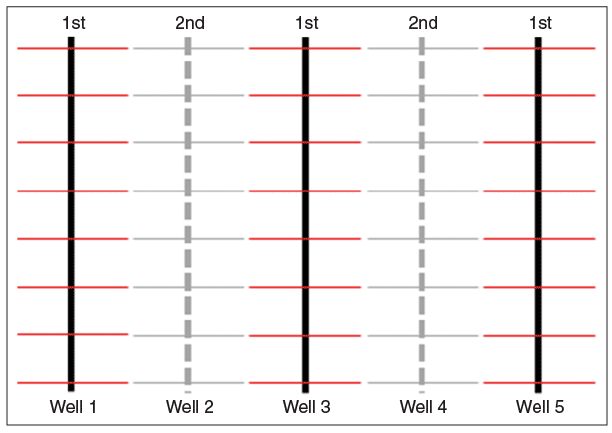
The infill timing scheme results in new wells being drilled between existing wells. Figure 1 shows the sequences at which wells are initiated, with the first, third and fifth wells drilled and fractured initially (denoted by “1st” at the top of the figure), followed at a later date by drilling and fracturing two infill wells (second and fourth wells). From a modeling standpoint, the two infill wells do not come on line until the specified percentage of EUR for each of the three initial wells has been produced. The times for the first infill wells based on total cumulative production ranged from 275 days (12.5 percent) to 14,885 days (87.5 percent) for 5 nD permeability, and from 225 to 2,633 days, respectively, for 500 nD.
Because the recovery factor is not sensitive to timing, NPV provides far more detail regarding the viability of each successive well. With similar trends for each value of reservoir permeability, one permeability value for each type of drilling scheme was analyzed. For a 5 nD reservoir, infill wells resulted in a significant NPV reduction of between 37.5 and 62.5 percent of the total cumulative production from the initial wells.
In other words, if two wells were anticipated to produce 5 billion cubic feet each, once 1.5 Bcf-3.0 Bcf (37.5-62.5 percent of the cumulative) has been produced from each well, drilling an infill well between them would result in a very low NPV. The 87.5 percent cumulative production case had almost zero NPV for infill wells, making the infill drilling decision obvious. A similar trend existed for both the 50 and 500 nD cases, although the magnitude of NPV loss was lower at these higher permeabilities.
FIGURE 2
Linear Timing Scheme with Wells Drilled Sequentially in Offset Direction
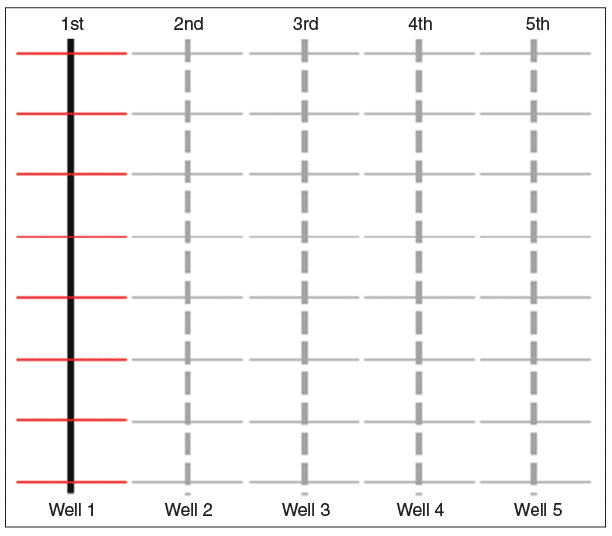
Figure 2 shows a linear scheme where the first well is drilled, stimulated and put on production, followed successively by offsets to each previous well. The same timing methodology was applied so that the second well came on line at 12.5 percent of the first well’s EUR, the third well at 12.5 percent of the second well’s EUR, etc.
The rate of NPV decline increased as the percentage of total cumulative production increased. For linear offset drilling, the risk of NPV reduction clearly increases as time progresses. In fact, a decrease of approximately 50 percent would occur after the initial well produced 62.5 percent of the total anticipated EUR. A 67 percent reduction would occur after 87.5 percent total cumulative had been produced. The rate of NPV decay is larger at lower permeabilities. After 87.5 percent total cumulative production, NPV was reduced by a maximum of 50 percent for 500 nD permeability, while the 5 nD case exhibited up to a 95 percent reduction.
FIGURE 3
Hybrid Timing Scheme with Initial Wells Drilled Sequentially and Spaced to Allow Infill Wells
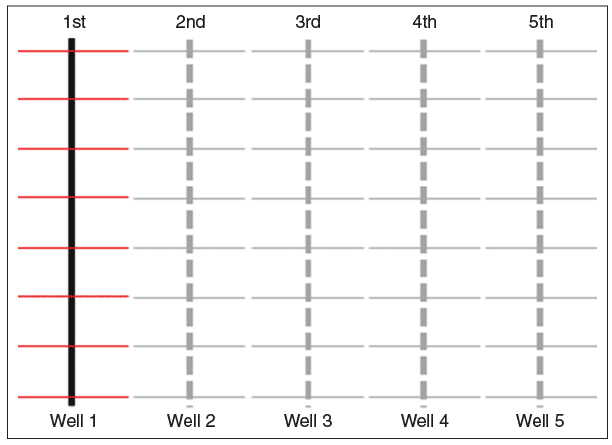
Figure 3 illustrates a hybrid scheme, with initial wells placed with room for one infill to be drilled in between. In this modeling approach, Well No. 1 is drilled in the far left of the section block, followed by Well No. 3 in the middle of the section after the first well reaches a specified percentage of cumulative production. Well No. 5 is then placed in the far right of the section, followed by Well No. 2 as an infill between wells 1 and 3. Well No. 4 is drilled last between wells 3 and 5.
All three permeability cases exhibited the same trend of declining NPV. The 500 nD cases had an NPV decline for all wells, even wells 3 and 5, which appeared to be in virgin reservoir. NPV decreased between wells 1 and 3 after adding Well No. 2, because that infill well robbed production from Well 3 (by the time Well 2 had been drilled, Well 1 had sufficient time to fully drain its area). Despite having lower permeability, the lack of pressure support for wells 3 and 5 was apparent by the significant NPV reduction with the addition of the two infill wells, with the percentage of NPV loss increasing as total cumulative production increased.
FIGURE 4
Impact of Timing Scheme on NPV (No SRV Overlap)

Figure 4 summarizes the results for nonoverlapped SRV completions. The graph on the left shows the impact of each drilling scheme on total NPV for the section at 50 nD reservoir permeability. The infill drilling scheme had the lowest decrease in NPV, with both linear and hybrid schemes having approximately the same NPV loss. The trends for the infill scheme at the various permeabilities show that NPV for the section drops at all reservoir permeability values for cumulative production greater than 62.5 percent. This drop can be attributed to the loss of NPV on the two interior infill wells.
Overlapping SRVs
With overlapping fractures, the fractures from neighboring wells drilled on dense spacing overlay one another in extent and offset in a crisscross pattern, similar to a zipper. To investigate the impact scheduling may have with overlapping fractures, the study analyzed a 25 percent SRV overlap (i.e., 25 percent of a well’s SRV is shared with neighboring wells on either side).
The extent of SRV overlap increases as the distance between wells decreases, and overlapping by greater than 50 percent can cause reduced NPV. At a fracture half-length of 500 feet, 25 percent overlap has a well spacing of 875 feet compared to zero overlap on 1,000-foot spacing. This reduced distance between wells implies that six wells can be placed in a 640-acre section rather than five.
FIGURE 5
Infill Drilling Scheme with 25 Percent SRV Overlap
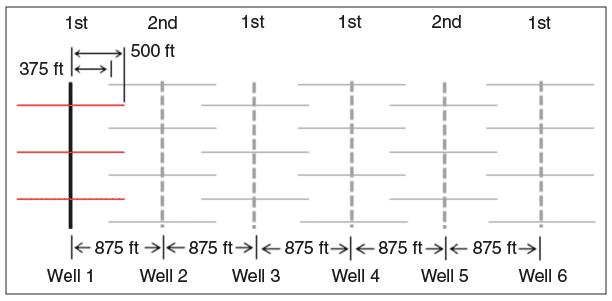
FIGURE 6
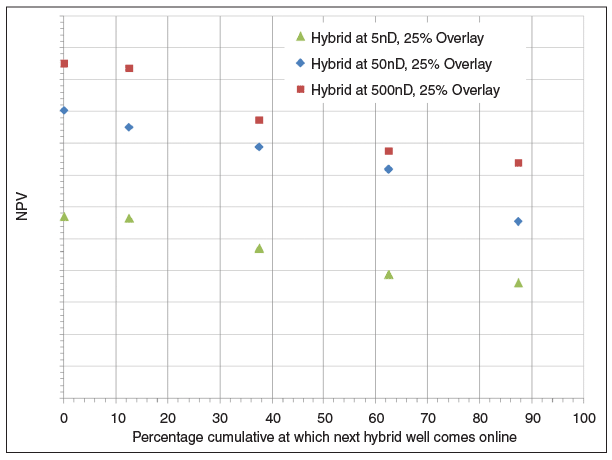
Hybrid Trend Plot at 25 Percent SRV Showing NPV Loss
With SRV overlap, subsequently drilled wells experience depleted areas as a result of pressure drawdown from previously drilled wells. Figure 5 depicts the infill drilling scheme with 25 percent SRV overlap. The modeling results showed NPV declining sharply with later infill drilling (Figure 6). Compared to the case where all wells in a section start production at the same time, NPV decreased by more than 60 percent at 5 nD reservoir permeability, and 14 percent on an average for the higher permeabilities of 50 and 500 nD.
The study analyzed pressure behavior at various times for all three field development methods with 25 percent overlapped fractures. With 50 nD reservoir permeability, the linear approach results in the initial pressure dropping 2 percent by the time the infill well starts using 12.5 percent cumulative timing. For the later cumulative timing sequences, the locations where infill wells are drilled show a region of depletion in which initial pressure drops from 11 (at 37.5 percent total cumulative) to 50 percent (at 87.5 percent total cumulative).
The infill sequence shows that at five and 10 years, the drainage profile is similar to a case where all wells start producing at the same time. The lower initial pressure and later start times led to decreases ranging from 21 to 54 percent of the infill wells’ total cumulative production. The linear drilling scheme with SRV overlap produced the same trend, with NPV dropping as wells were added in time.
Using the hybrid scheme with 25 percent SRV overlap resulted in very little NPV loss when the wells were at 12.5 percent cumulative, but NPV started diminishing at 37.5 percent cumulative production. Similar to linear drilling, NPV began to decline sooner at lower permeability factors.
At a reservoir permeability of 50 nD and 37.5 percent cumulative, the pressure profile at the end of one year showed the first well drilled in the section at 3,200 psia using the hybrid scheme. When the second well (Well No. 3) starts production in the third year, pressures for Well 1 decline to 2,200 psia. By the time the third well (Well No. 5) comes on line in the fifth year, Well 1 depletes to 1,300 psia, Well 3 is at 2,600 psia, and the region around the first future inset (Well No. 2) is still 3,200 psia.
But by the time Well No. 2 is drilled and put online, its initial pressure is 30 percent lower than initial reservoir pressure. The same scenario is repeated with the sixth and final well. Although the field is not fully drained, the presence of pressure depletion around wells 2, 4 and 6 diminishes their productivity.
The results of the study indicate that there is a small reduction in the recovery factor for field development projects using nonoverlapping fractures with infill and offset drilling at high reservoir permeabilities (greater than 50 nD). At low reservoir permeabilities, it is advisable to have infill and offset wells start as early as possible (before reaching 62.5 percent of the total cumulative).
If fractures are overlapped, wells drilled and completed after the initial wells have been on production can be expected to have areas of depletion that impact recovery and NPV. The recovery factor and NPV are both reduced for infill or linear hybrid approaches of offset drilling with SRV overlap. For all reservoir permeabilities, it is not recommended to drill the last two wells in the hybrid scheme when fractures do not overlap (wells 2 and 4) and the last three wells with SRV overlap (wells 2, 4 and 6) for total cumulative production greater than 37.5 percent since recovery and NPV are both low.

Vivek Sahai is a senior reservoir engineer at Weatherford. With 15 years of experience in computational fluid dynamics, he has modeled various processes to help evaluate, design and improve industrial technologies. Sahai has done extensive work using 3-D finite element reservoir modeling technology to model and forecast wells in the Haynesville and Marcellus shale plays, including examining mechanisms that affect well performance and optimized well spacing, and also has conducted reservoir simulation projects in tight gas reservoirs and conventional waterfloods. He holds B.S. degrees in mechanical engineering and mathematics from Tennessee Technological University, an M.S. in mechanical engineering from Tennessee Technological University, and a Ph.D. in mechanical engineering from Vanderbilt University.

Greg Jackson is Weatherford manager of petroleum consulting for continental Europe, based in Bucharest, Romania. He previously served as business development manager for unconventional resources in the Europe-Caspian. He has analyzed numerous wells in virtually every major North American shale basin, and is applying that experience to aid in the development of European shale plays. Jackson has a master’s in petroleum engineering with a focus on reservoir engineering from the University of Texas at Austin.

Rakesh Rai is a petroleum consulting advisor at Weatherford. He has 15 years of experience working for oil field service companies and an integrated oil and gas company. Rai’s core work areas include reservoir modeling, reservoir simulation, production optimization and forecasting, economic analysis, sensitivity analysis, development scheme optimization, well testing, and nodal system analysis. Rai has extensive experience in unconventional gas fields in the United States and South America. He has also worked on the characterization of conventional Gulf of Mexico reservoirs. He holds a B.E. in petroleum engineering from the University of Pune in India and an M.S. in petroleum engineering from the University of Texas at Austin.
For other great articles about exploration, drilling, completions and production, subscribe to The American Oil & Gas Reporter and bookmark www.aogr.com.