


Global Oil Market
EIA Forecasts Growth For Both Demand, Production
WASHINGTON–The number of drilled but uncompleted wells in U.S. shale plays reached the lowest level in four years in June, according to the U.S. Energy Information Administration.
At 6,252 wells, the number of DUCs was down sharply from 7,659 in June 2020, 8,208 in June 2019, and 7,943 in June 2018. This June’s count is more in line with June 2017, when EIA recorded 6,031 DUCs (EIA began acquiring DUC data in September 2016).
The Permian Basin, the most active drilling and completion region with the largest number of DUCs, follows the same national pattern. The 2,475 DUCs in the Permian in June was nearly 40% below June 2019, and off more than 1,000 from June 2020. EIA tallied 2,244 uncompleted drilled wellbores in June 2017. By the end of that year, that number had swollen by an additional 500 wells and would go on to top 3,000 for the first time in April 2018 and surpass 4,000 in early 2019.
Of course, a dwindling number of DUCs in inventory implies a greater demand for drilling rigs as producers work to offset natural production declines with new-well completions. Even with DUCs decreasing (implying the completion of previously drilled wells), new-well oil production per rig in the Permian was only marginally higher in June than it been in June 2018 (1,234 versus 1,228 barrels a day per rig) when roughly twice as many rigs were drilling in the basin.
In its July Short-Term Energy Outlook, EIA forecasts that 2022 global consumption of liquid fuels will exceed pre-pandemic levels. After falling by 8.6 million barrels a day year-over-year on average in 2020, the agency expects global consumption to grow by 5.3 MMbbl/d in 2021 and rise by an additional 3.7 MMbbl/d next year to 101.4 MMbbl/d, which would top 2019’s all-time record daily demand.
Mirroring broader global trends, EIA states, “We forecast U.S. liquid fuels consumption will rise to 19.6 MMbbl/d in 2021 and then to 20.7 MMbbl/d in 2022.” That would not only completely recover the 2.4 MMbbl/d year-to-year decline in U.S. liquid fuels consumption seen in 2020 (average of 18.1 MMbbl/d), but surpass pre-pandemic levels of daily domestic demand.
However, EIA says higher output from OPEC+ members and accelerated growth in U.S. tight oil plays will lead to a scenario in which production increases by more than consumption in the months ahead, balancing the market at the higher demand level. Brent spot prices averaged $73 a barrel in June, up $5/bbl from May. Its forecast calls for Brent to average $72/bbl over the second half of this year and $67/bbl for full-year 2022.
“Based on our estimates, global liquid fuels inventories rose by 6.3 MMbbl/d in the first half of 2020 before declining at an average rate of 2.1 MMbbl/d in the second half of 2020 and first half of 2021, the STEO reads.
EIA projects that global inventories will continue to fall in the near term, but at a slower rate of 0.2 MMbbl/d in the second half of this year, before starting to rise by an annualized average of 0.5 MMbbl/d in 2022.
As of early July, U.S. commercial crude oil inventories were 437.6 MMbbl or 8% below the five-year trend line. According to EIA weekly data, U.S. crude oil inventories have fallen by more than 100 MMbbl over the past year after topping out in July 2020.
FIGURE 1
Global Liquids Fuels Production and
Consumption Balance
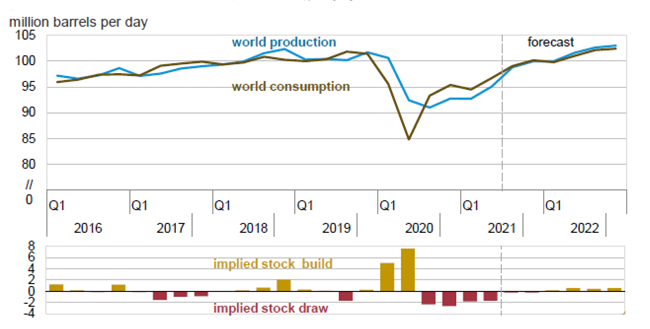
Source: U.S. Energy Information Administration, Short-Term Energy Outlook, July 2021
Natural Gas
Driven by higher natural gas pricing, EIA says U.S. dry gas production will average 92.6 billion cubic a day in 2021–up 1.3% from 2020–and then climb to 94.7 Bcf/d in 2022.
“We expect Henry Hub prices will rise to an annual average of $3.22/MMBtu in 2021, and we forecast prices will average $3.00/MMBtu in 2022,” the reports states. Henry Hub spot prices averaged $2.03/MMBtu in 2020.
After slipping by 2.2% in 2020, U.S. natural gas consumption is projected to decline by 1.1% in 2021 and then rebound by 0.7% in 2022. “Most of the forecast decline in consumption this year is the result of less natural gas use in the electric power sector, which we expect to continue to decline because of rising natural gas prices,” EIA explains.
U.S. working natural gas storage inventories ended winter at 1.8 trillion cubic feet, slightly below the five-year average. Flat domestic gas production this summer, combined with record U.S. liquefied natural gas and pipeline exports, will contribute to lower-than-average inventory builds heading toward the start of the 2021-22 winter heating season, the agency reports. Consequently, its models show end-of-October inventories down 3% from the five-year average of 3.6 Tcf.
Financial Metrics
In a financial analysis of 91 global oil and gas companies with publicly available financial statements, EIA reports that 76% had positive free cashflow in the first quarter and 75% reported positive upstream earnings. Of the companies analyzed, 54 are based in the United States, 17 are Canadian, 10 are based in Europe, and 10 are located elsewhere around the world.
The 91 companies’ production of both oil and gas remained lower than the average reported in the first-quarter 2019, with oil production successively down each quarter starting in the second quarter of 2020. Specifically, EIA says the companies’ combined petroleum liquids production was down 11.4% and natural gas production was down 4.2% in the first quarter compared to the same period in 2020.
However, as a reflection of the recovery in oil and gas prices, cash from operations in the first quarter totaled $79 billion, which EIA calculates at 19% higher than in the first quarter of last year.
FIGURE 2
U.S. Oil Production
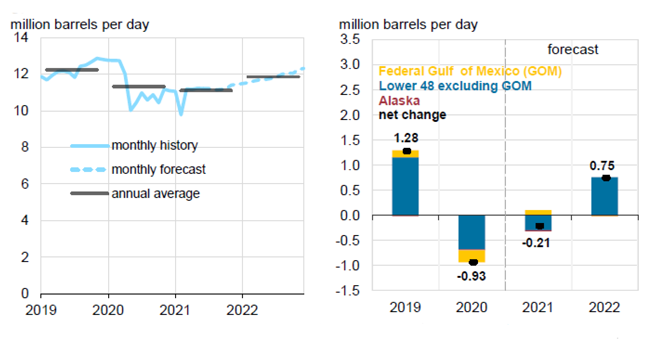
Source: U.S. Energy Information Administration, Short-Term Energy Outlook, July 2021
Their capital expenditures totaled $48 billion in the first quarter, or 28% lower than in the first three months of 2020 and significantly lower than the five-year average (it was the second lowest amount for any quarter since 2016). On a barrel of oil equivalent basis, their upstream capital expenditures averaged $8/boe, representing only 18% of crude oil prices in the first quarter.
The 91 companies’ combined market capitalization increased by 42% from the previous year’s first quarter. The companies also repaid debt, decreasing their total debt by $16 billion and decreasing their aggregate long-term debt-to-equity ratio to 54% in the first quarter.
For other great articles about exploration, drilling, completions and production, subscribe to The American Oil & Gas Reporter and bookmark www.aogr.com.