


Gas Markets
EIA Forecasts ‘Sharp Increases’ In Natural Gas Prices
WASHINGTON–Natural gas prices will continue to build as the winter heating season approaches, and the U.S. Energy Information Administration anticipates that the momentum will be sustained throughout 2021, according to the August Short-Term Energy Outlook (STEO).
“EIA expects sharp increases in U.S. natural gas prices this fall and winter,” the report declares. Specifically, the agency says Henry Hub spot prices will lift by 55% on an average annualized basis–from $2.03 per MMBtu this year to $3.14/MMBtu next. In mid-August, gas was trading at $2.35 at the Henry Hub and November futures were at $2.80/MMBtu, with the January futures strip at $3.21/MMBtu.
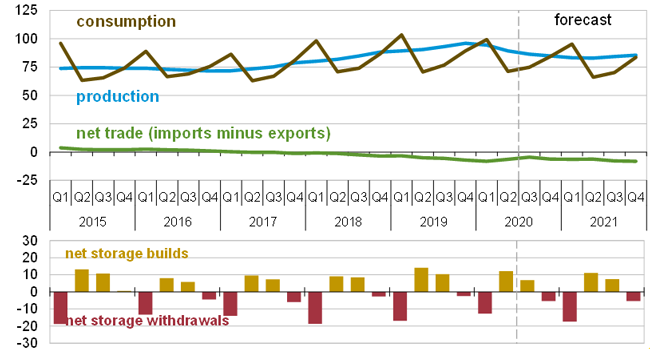
“After setting an annual record in 2019, natural gas production has fallen as low oil and natural gas prices caused producers to cut back on drilling (in 2020),” the report explains. “EIA estimates U.S. dry natural gas production will be down 3.6 billion cubic feet a day in 2020 and decline a further 4.6 Bcf/d in 2021 (Figure 1).”
FIGURE 1
U.S. Natural Gas Production, Consumption and Net Imports (Bcf/d)
The higher prices are expected even though U.S. liquefied natural gas exports and industrial demand remain below 2019 levels as markets recover from the COVID-19 economic shut down. That is partly thanks to the electric power sector, where EIA says gas-fired power facilities’ share of total U.S. power generation has increased from 37% in 2019 to 40% this year, even with reduced business activity.
In fact, the agency estimates that natural gas consumption by the electric power sector in July was the highest monthly average on record. Power plant consumption reached an all-time high on July 28 amid peak summertime cooling demand, according to a separate EIA report.
Despite a 5% decline in total electricity generation in the lower-48 in the first half of 2020 compared with the first half of 2019, gas-fired generation increased nearly 55,000 gigawatt-hours (GWh), the report offers. That represented a 9% annual increase and made natural gas the fastest-growing source of electric power generation. In contrast, renewables (including wind, solar and hydroelectric) increased 5%, and were the only fuel source category other than natural gas to grow in the first six months of the year.
Because of low natural gas prices through the first half of the year, coal-fired generation has been uneconomical in most regions compared with gas-fired generation, leading to coal-to-gas fuel switching. The agency forecasts that natural gas consumption in the power generation market will ebb in 2021 in response to significantly higher gas prices, with coal picking regaining most of that market share, but says more new natural gas-fired capacity is on the way.
Coal-To-Gas Switching
EIA says coal-to-gas switching in the first half of the year was most prominent in the PJM Interconnection, which covers an area stretching from New Jersey to Illinois, and the Mid-Continent Independent System Operator (MISO) in the Midwest. Combined, PJM and MISO account for 35% of the total lower-48 electric power generation. Gas-fired generation increased by 17,000 and 15,000 gigawatt-hours, respectively, in PJM and MISO in the first six months, while coal-fired generation declined 34,000 and 40,000 GWh, respectively.
In the Electric Reliability Council of Texas (ERCOT), which generates 10% of total lower-48 power, declines in coal-fired generation were not directly offset by increases in gas-fired generation as in PJM and MISO, EIA notes. Despite coal-fired generation declining 8,650 GWh year-over-year through the first half of 2020, gas-fired generation also declined slightly, as most of coal’s share was offset by increases in wind and solar generation, which together increased 8,400 GWh.
Capacity additions also have contributed to growth in gas-fired generation. A total of 18,000 megawatts of net capacity from new combined-cycle gas turbine plants has entered service since 2018. “Output from these highly efficient plants has been steadily ramping up and helping to drive increases in generation,” EIA says. “During the 30-month period from January 2018 to June 2020, 31,000 megawatts of net capacity for coal-fired plants retired along with 2,400 megawatts in net capacity for nuclear power plants.”
Between 2011 and 2019, 121 coal-fired plants were repurposed to burn other types of fuels, 103 of which were converted to or replaced by gas-fired plants. The United States had 316.8 gigawatts of coal-fired capacity at the end of 2010, but 49.2 gigawatts of that amount had been retired by the end of 2019. Of those plants, 14.3 gigawatts were converted to burn natural gas in the boilers instead of coal, and 15.3 gigawatts was replaced with gas combined-cycle plants, EIA details.
“Between 2011 and 2019, owners of 17 coal-fired plants (replaced) old plants with new combined-cycle plants. The new plants have a total generating capacity of 15.3 gigawatts, 94% more than the 7.9 gigawatts of capacity of the coal-fired power plants they replaced. The increase in capacity is largely a result of the advanced turbine technology installed in combined-cycle plants,” the agency reports, noting that 104 coal-fired plants converted their steam boilers to burn other fuels, predominately natural gas, during the same period.
Coal-fired plants in the eastern part of the country have been the best candidates for conversion, EIA relates, because they tend to be older and have smaller capacities. “Of the 104 coal-fired plants in this age range, 86 have converted their boilers to burn natural gas,” the agency says. “Although most transitioned entirely to natural gas, a few maintained coal-burning capabilities, allowing them to burn whichever fuel is most economically efficient.”
Alabama Power Co. is the utility with the most conversions over the past eight years, converting 10 boilers located at four coal plants in Alabama with a total of 1.9 gigawatts of capacity.
“EIA expects more of these conversions to take place in the future, particularly in the Midwest and Southeast,” the report concludes. “EIA has been notified of eight planned combined-cycle projects, five of which are currently under construction, which will replace existing coal plants.”
Declining Oil Inventories
Turning to crude oil markets, global inventories of crude oil are draining at a rapid pace, completely reversing a trend of substantial inventory builds in the first half of the year, according to the August STEO.
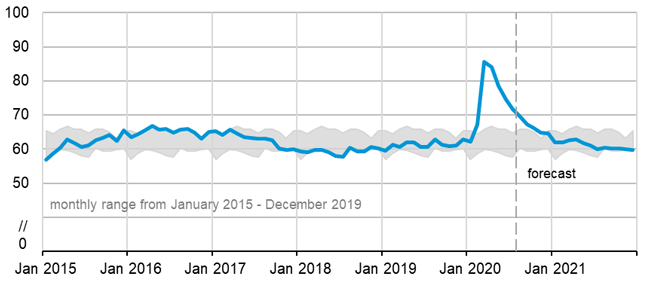
Through the first six months of 2020, inventories grew at a rate of 6.4 million barrels a day, although the average build was skewed by the second quarter, when economies around the world began temporarily shutting down to slow the spread of COVID-19. However, EIA says that situation has flipped, and forecasts that global liquid fuels inventories will decline at a rate of 4.2 MMbbl/d in the second half of 2020 (Figure 2).
FIGURE 2
OECD Commercial Crude Oil and Liquids Inventories (Days of Supply)
The agency projects that liquids fuels inventories will continue to shrink throughout 2021, decreasing by an average 800,000 bbl/d.
“As inventories decline into 2021, upward price pressures will increase,” EIA states. While it says historically high inventory and surpluses will limit price upside in the near term, it expects prices to continue to strengthen in coming months, with Brent averaging $43/bbl from June to December and rising to $50/bbl on average next year. Those price projections are up by $6/bbl and $2/bbl, respectively, from the June monthly STEO. In mid-August, Brent was trading above $45.00.
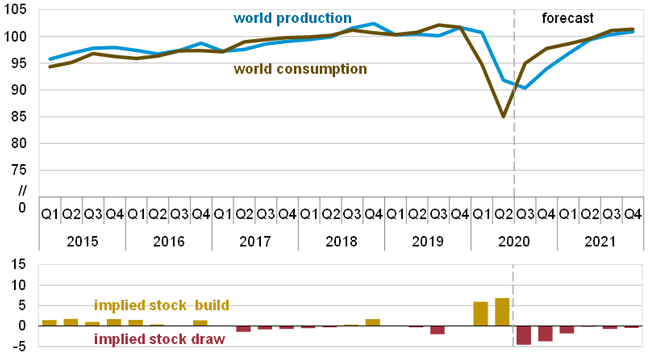
FIGURE 3
Global Liquids Fuel Production and Consumption Balance (MMbbl/d)
In the August STEO, EIA also revised downward by 370,000 bbl/d its estimate of average U.S. crude oil production this year. “We now expect U.S. crude production to average 11.3 MMbbl/d in 2020 and 11.1 MMbbl/d in 2021, down from 12.2 MMbbl/d in 2019,” the report reads. “May’s average U.S. crude oil production was 1.2 MMbbl/d lower than we assessed in July, indicating more extensive production curtailments than previously estimated.”
Total global supply of liquid fuels is expected to fall by 6.4 MMbbl/d this year, and average 99.4 MMbbl/d in 2021, or 800,000 bbl/d less than the 100.2 MMbbl/d in anticipated demand (Figure 3). According to EIA, global consumption will rise through the end of 2021, recovering to within 400,00 bbl/d of 2019’s record level.
For other great articles about exploration, drilling, completions and production, subscribe to The American Oil & Gas Reporter and bookmark www.aogr.com.