


Production Forecast
Growth Trajectory Ahead For U.S. Oil Output
HOUSTON–According to Rystad Energy data, U.S. crude oil output rebounded in the first half of the year to reach 11.45 million barrels a day in June, and is forecast to grow by another 60,000 bbl/d to average 11.51 MMbbl/d in both July and August. A dip is then expected in September and October to 11.34 MMbbl/d and 11.41 MMbbl/d, respectively.
A constant, albeit slow growth trajectory will commence in November 2021, when Rystad forecast crude output will back to 11.55 MMbbl/d and close the year at 11.62 MMbbl/d in December. It sees output continuing to rise, breaking the 12 MMbbl/d monthly average in October 2022 but falling short of pre-pandemic highs through the 2023.
The Permian Basin is expected to drive nearly all oil production growth through 2023 by boosting oil output to 5.3 MMbbl/d-5.4 MMbbl/d while the rest of the country remains largely in a maintenance mode, according to Artem Abramov, Rystad’s head of shale research.
Despite the continuous growth, U.S. monthly output is not expected to match the record 12.9 MMbbl/d achieved in 2019 anytime soon (Figure 1). The “muted” U.S. supply response is partly a function of publicly traded operators remaining committed to capital discipline and returning dividends to shareholders, says Abramov.
FIGURE 1
Forecast U.S. Oil and Dry Gas Production (Base Case)
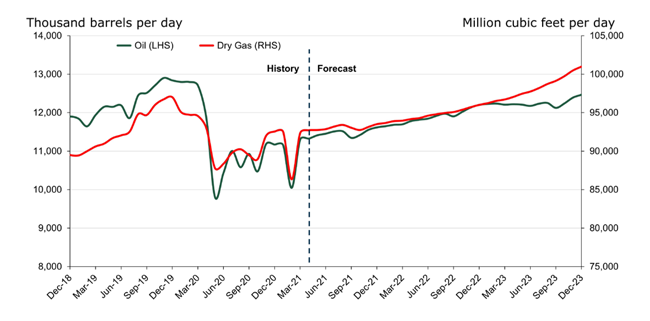
Note: Rystad Energy's production outlook is based on our current oil and gas price base cases, which are subject to changes going forward
Source: Rystad Energy ShaleWellCube, Rystad Energy OilMarket Cube
It is also partly the result of hedging positions by larger producers, he goes on. Companies with significant volumes of their 2021 crude output hedged at prices below current WTI spot prices are disincentivized to boost production, Abramov explains.
“However, less than 40% of the total expected shale oil output in 2021 is hedged, meaning there are many operators that would be highly incentivized by higher WTI prices, especially private producers,” he points out. “For them, there could in theory be some upside to production if higher prices are perceived as a structural change rather than short-term rebalancing.”
Gradual Supply Response
Nevertheless, no major supply response is possible from producers before the second quarter of 2022, Abramov contends, adding that the industry is still relying heavily on drilled but uncompleted wells, and operators would first need to increase drilling before they could seriously ramp up well fracturing activity.
“Even if the U.S. shale industry wanted to produce more, the time required from a price signal to a significant production impact is at least nine months, including the time it takes to make an investment decision, the months needed from spud to frac end, plus the last stage from frac end to peak production,” Abramov remarks.
Looking at U.S. gas production, he says Rystad continues to call for a gradual recovery toward the pre-pandemic peak, with nationwide dry gas output surpassing 96 billion cubic feet a day by the end of 2022 (Figure 2). Most of the production growth in the second half of 2021 and in 2022 will be driven by the Permian and Haynesville, with moderate growth in Appalachia conditional on takeaway capacity expansions.
FIGURE 2
Total Free Cashflow for All Public Producing Companies and Brent Oil Prices
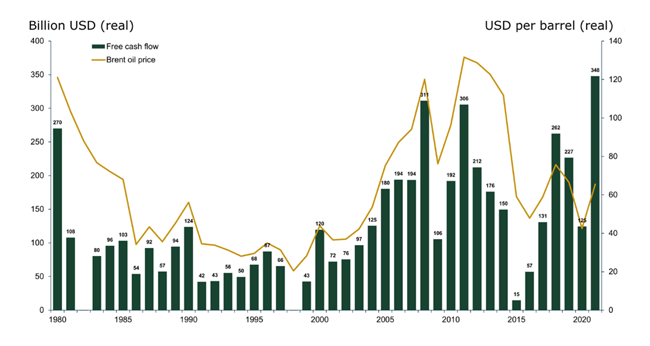
*FCF includes all cash flows from upstream activity. It does not include cash related to financing or heding effects
Source: Rystad Energy UCube
In fact, Abramov reports that Rystad’s base-case outlook suggests that associated gas from the Permian, Eagle Ford, Williston and Rockies will outperform growth from the core Appalachia and Haynesville gas plays. Gas production from core oil regions is expected to account for 32.2% of the nation’s dry gas output in December 2023, up from 30.3% last December. In turn, the contribution from the core gas regions to the nation’s total is expected to increase from 49.0% to 50.2% over the same period.
Rystad Energy data shows that U.S. natural gas liquids supply reached a new high of 5.62 MMbbl/d in April, eclipsing the previous record of 5.54 MMbbl/d set in July 2020.
Record Cashflows
With oil and gas prices recovering and investment activity remaining low, the world’s publicly traded exploration and production companies are set to generate record free cashflows this year, projects a separate report from Rystad Energy.
Before factoring in the effects of producers’ hedging programs, Rystad says public companies’ combined free cashflows from upstream operations are poised to surge to $348 billion, surpassing the previous high of $311 billion in 2008.
Rystad estimates that total gross revenue for all public upstream companies is expected to increase by almost $500 billion in 2021, or 55% compared to last year, excluding hedging settlements. At the same time, the investment level of these companies is only expected to grow by 2% in 2021, resulting in significantly higher profits.
Obviously, a key reason for the all-time-high free cashflows is the turnaround in the U.S. tight oil sector. “The industry has struggled to generate positive returns, but this could change in 2021,” the report states. “We estimate that all public tight oil companies will make close to $60 billion in free cashflows this year before hedging effects.”
The conventional onshore supply segment is in line to earn the highest level of free cashflow this year at close to $160 billion, but is still behind the record offshore totals touched in 2011. While both the deepwater and offshore shelf are recovering (each is projected to end up with close to $60 billion in free cashflows), tight oil is expected to surpass both offshore segments in 2021.
With operators enjoying “super profits,” barometers of the industry’s overall health are looking decidedly better that they were even a few months ago, notes Espen Erlingsen, head of upstream research at Rystad.
“Historically there has been a strong link between free cashflow and activity levels. Merger and acquisition activity has recovered in 2021, with transaction values increasing by 30% compared to 2020. New projects are also making a comeback. The amount of greenfield investments that had been sanctioned as of June already matched the full-year 2020 total, and we expect the full 2021 level to be double that of last year,” Erlingsen concludes.
For other great articles about exploration, drilling, completions and production, subscribe to The American Oil & Gas Reporter and bookmark www.aogr.com.