


Middle East Oil Insights
Iraq’s Future Key To U.S. Oil Prices
By George S. Littell
HOUSTON–The rapid development of gas shales in the United States has been an overwhelming technical success, with domestic natural gas production jumping to all-time highs. Yet, it also has resulted in lower North American natural gas prices. Last winter’s record storage withdrawal has bolstered prices in 2014, with spot prices at Henry Hub averaging $4.78 per million Btu on a monthly basis through the end of July on the New York Mercantile Exchange. However, annualized Henry Hub spot prices on NYMEX fell from $8.86 in 2008 to $3.73 in 2013.
A big part of that decline was certainly due to the recession of 2009 and the continuing lingering effects of a slow economic recovery, but the fact is that supply growth has outpaced demand in North American natural gas markets.
Following the same production pattern as in gas shales, the development of oil shales and tight oil formations has led to U.S. crude oil production surging by some 3.5 million barrels a day since 2008, and oil output is on track to soon eclipse the “peak oil” days of the early 1970s. So far, however, U.S. oil production growth has had less impact on crude oil prices because of events in the Middle East.
As daily news headlines make clear, the Middle East rarely has been more turbulent or violent. Seemingly, the entire region is embroiled in conflict, and the political uncertainty and tension is being felt around the globe. With respect to global oil prices, however, the decision by the government of Iraq to allow foreign participation in its oil industry is one of the more significant events in recent history. Whether Iraq can emerge as an oil power, and how that emergence will be handled, could potentially be major determinants of future crude oil prices, similar to the situation after Iraq’s war with Iran ended in 1988.
FIGURE 1
Btu Equivalent Global Oil and Gas Prices
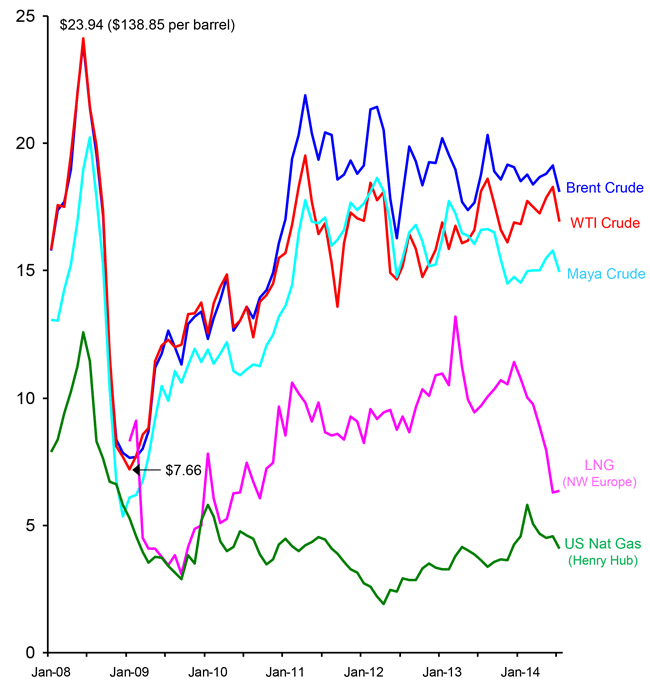
Figure 1 is a record of prices (in million Btus) beginning in January 2008 for Brent, West Texas Intermediate, and Maya crude oils, for liquefied natural gas delivered to Northwest Europe, as well as for U.S. natural gas at Henry Hub.
As 2008 began, there were 25 proposals to construct terminals to receive and regasify LNG in North America. A total of nine were actually built (five in the United States and two each in Canada and Mexico) with a daily combined capacity of nearly 14 billion cubic feet. Little of that capacity has been used, however, because U.S. gas production has increased by 14 Bcf a day since January 2008, with a 27 Bcf/d increase from shales offsetting 13 Bcf/d in production declines from other formations. The production increase was achieved with prices competitive with coal in North America.
The LNG supplies originally intended for North America were diverted to Asia, Europe and Latin America. In the Atlantic Basin, the result has been prices for LNG well below the Btu equivalent of crude oil. As LNG production outside North America continues to increase, the LNG prices in Northwest Europe have started to approach prices at Henry Hub.
Supply And Demand
In January 2008, the United States imported 2 million barrels a day of crude oil from Canada and 1.2 million bb/d from Mexico (3.2 million bbl/d total), and another 6.9 million bbl/d from other sources. In May 2014, U.S. crude oil imports totaled 2.5 million bbl/d from Canada and 700,000 bbl/d from Mexico (the same 3.2 million bbl/d total), but only 4.7 million bbl/d from other sources. With all other things the same, a 2.2 million bbl/d reduction in North America imports should have reduced crude oil prices by about $25 a barrel by making that oil available in Asia, Europe and other markets around the world.
Of course, other things have not been the same since the Arab spring of 2011. Table 1 shows a comparison of oil volumes and prices in 2013 with volumes and prices in 2010.
TABLE 1
Changes to Oil Supply,
Demand and Price (million bbl/d)
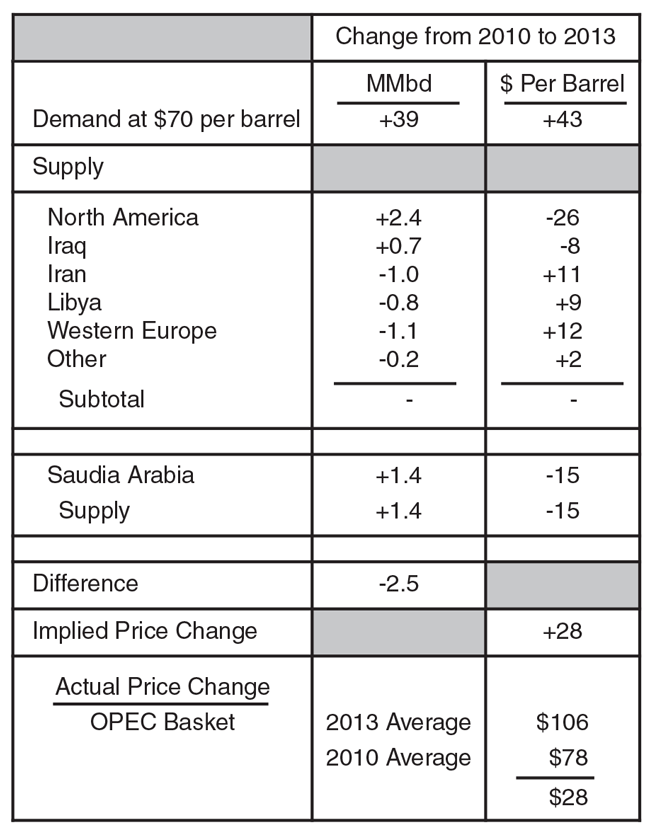
Demand is the relationship between price and consumption. At a price of $70 per barrel, oil consumption in 2013 would have been 91 million bbl/d, or 3.9 million bbl/d more than 87.1 million bbl/d of consumption at that price in 2010, but only 1.4 million bbl/d more than the 88.7 million bbl/d that would have been consumed in 2008. The 5.2 million bbl/d drop in oil demand in 2009 due to the financial crisis had no precedent, and the recovery has been weak. Over five years, 1.4 million bbl/d is an average annual increase of less than 300,000 bbl/d.
The increases in supply from North America and Iraq after 2010 were almost entirely offset by decreases in Iran, Libya and Western Europe. The increase in Saudi Arabia’s production from 8.2 million to 9.6 million bbl/d was 2.5 million bbl/d less than the 3.9 million bbl/d increase in demand. As a result, the price of the Organization of Petroleum Exporting Countries basket averaged $106 a barrel in 2013 versus $78 a barrel in 2010.
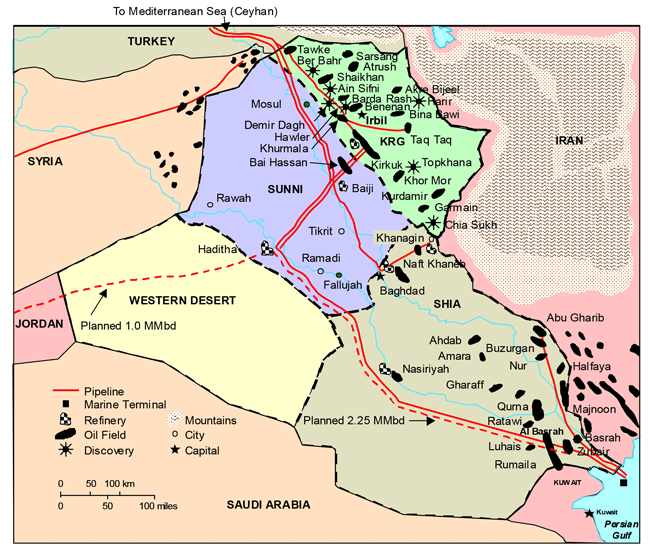
The declines in Iran’s oil production all occurred after the imposition of severe U.S. sanctions in July 2012. It was just in time to offset a temporary recovery in Libya’s production. Neither the U.S. sanctions nor the current anarchy in Libya are necessarily permanent. Peak production of crude oil in Western Europe was 6 million bbl/d in 2000. In 2013, it was only 2.5 million bbl/d. Iraq is an entirely different story. Figure 2 is a map of oil operations in Iraq, with a demarcation of the areas where the population is predominately Shia Arabs, Sunni Arabs and Kurds.
FIGURE 2
Iraq Oil Operations
Onerous Terms
The oil industry of Iraq was nationalized in 1975. After the 2003 invasion, there was a lengthy and contentious debate within Iraq’s federal government over the wisdom of ending its monopoly and allowing foreign participation. There was no similar controversy within the Kurdistan Regional Government (KRG). KRG signed its first exploration agreement with a Norwegian company in October 2004. It enacted an oil law in June 2007 and began offering production sharing agreements with conventional terms.
In late 2007, the federal parliament approved foreign participation, but it has yet to enact an oil law. Between November 2008 and October 2010, the federal ministry of oil held three bid rounds for foreign companies to operate in Iraq under service contracts. There were two major objectives in the process. The first was to avoid any possible charge that the oil ministry was “giving away” Iraq’s oil. The second was avoiding any favoritism of U.S.-based companies.
What emerged was 17 service contracts with 26 foreign companies; a “who’s who” of the international oil industry, with the notable exception of Chevron. Terms were easily the most onerous in the world. Foreign operators must fund all investments and assume technical risks in meeting production targets. With three minor exceptions, their compensation is limited to less than $2 a barrel.
In total, the service contracts were a plan to increase Iraq’s production of crude oil from 2.4 million bbl/d in 2010 to 9.4 million bbl/d in 2017 and 12.7 million bbl/d in 2020, which would be about equal to Saudi Arabia’s current capacity. With two minor exceptions, all of them were for fields in southern Iraq. No contract was offered for Kirkuk although it was the first field discovered in Iraq. The oil ministry did not attempt to offer service contracts in KRG’s territory, but did declare KRG’s contracts illegal.
In retrospect, the federal government’s handling of the oil industry was the first indicator that its policy would be “government by Shia and for Shia.” After the occupation ended in December 2011, that policy became more extreme. It has pushed KRG close to declaring independence and incited the revolt in Sunni tribal areas that began earlier this summer.
Although Iraq is a founding member of OPEC, it has not been an active participant since Iraqi forces invaded Iran in September 1980. The effect successful execution of the service contracts might have on the oil market was not a consideration for the oil ministry. Under its terms, the foreign operators have no price risk and Iraq’s government has all of it. An “OPEC clause” does allow the government to determine production, but requires payment to the operators based on capacity (i.e., the volumes they could have produced).
An unusual feature of the service contracts is that the operators are responsible only for the activity within the boundaries of the fields. Everything else–including water, electricity, logistics, etc.–is the responsibility of the government. The foreign companies involved are accustomed to working in remote areas, and their usual practice is to provide themselves with what they need. The costs involved are recoverable under the terms of conventional production sharing agreements.
Similar Situation
Logistics have turned out to be the factor limiting growth in Iraq’s crude oil production. The finances of the federal government are a mystery, but it is clearly having trouble meeting its responsibilities. Easing the fiscal strain–rather than alleviating OPEC’s concerns–appears to be the motive for renegotiating the production targets in service contracts. The current plan is for 7.8 million bbl/d in 2017 (down from the original 9.4 million bbl/d) and 9.7 million bbl/d in 2020 (down from 12.7 million bbl/d). It continues to exclude any and all production from KRG territory.
Exploration in KRG territory has been highly successful. The whole area appears to be a carbonate petroleum system with potential for at least 2 million bbl/d of crude oil production. Government by Shia and for Shia may be giving way to some sort of “inclusive” regime in Iraq. KRG may be able to produce and market its oil while remaining part of Iraq. Whether it would be better off as an independent state is debatable. It could make a difference to OPEC. Algeria, Angola, Ecuador, Libya and Qatar are the current OPEC members producing less than 2 million bbl/d. They have consistently been of little use when OPEC attempts to limit production and increase prices.
Uncertain though it may be, the current situation in the oil market is similar to what it was 25 years ago. After the war with Iran ended in August 1988, Iraq’s efforts to increase production brought it into increasing conflict with both Saudi Arabia and Kuwait. The position of Iraq’s government at that time was that both should reduce production to “make room” in the market. The dispute led to the invasion of Kuwait in August 1990 and the start of the United Nations embargo of oil exports from Iraq. The embargo was relaxed over time. When it ended in May 1998, Iraq was producing 2.1 million bbl/d versus the 300,000 bbl/d it had produced in 1991. Following the invasion, oil prices were below $20 a barrel for the rest of the decade, with the low point in 1998, when global oil prices averaged $12.28 a barrel (about $28 a barrel in current dollars).
FIGURE 3
Comparison of U.S. and Saudi Arabian Oil
Productivity per Well
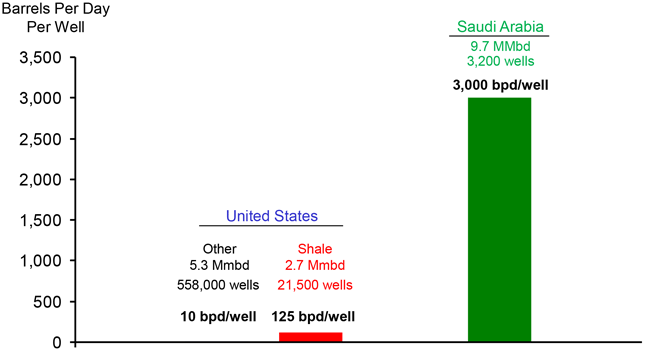
In the first half of 2014, crude oil production averaged 9.7 million bbl/d in Saudi Arabia and 8 million bbl/d in the United States. Figure 3 provides a comparison of the two countries’ oil production profiles.
Production from about 21,500 wells in shale plays (primarily the Bakken and Eagle Ford) accounted for 2.7 million bbl/d of U.S. production, with each well averaging 125 bbl/d. Another 558,000 wells averaging less than 10 bbl/d produced the other 5.3 million barrels. In contrast, Saudi Arabia’s 9.7 million bbl/d total came from 3,200 wells averaging a little more than 3,000 bbl/d. Capacity is 12.5 million bbl/d, or about 3,900 bbl/d per well. The two countries are on the same planet, but not in the same ballpark, or even same league. Iraq and KRG are in Saudi Arabia’s league, with many wells capable of producing 10,000+ bbl/d.
In early 2009, amid the collapse in demand, the Saudi government was unwilling to produce less than 8 million bbl/d, which is why the price of Brent crude ended up at $44.43 per barrel in January of that year. If the political situations in Iraq, Iran and perhaps Libya can be resolved, increasing production from these three countries would be expected to drive Saudi production to 8 million bbl/d again in the not-too-distant future. It would be a surprise if it is allowed to be less than 8 million bbl/d. In 1979 and 1980, Saudi Arabia produced 9.6 million bbl/d of crude oil. After the government started reducing production, the bottom turned out to be 2.5 million bbl/d in the summer of 1985.
Will Reason Prevail?
Something like the history of the 1990s is possible, although not likely. A major difference between the current situation and 1988 is Iran’s influence in Iraq, which was nonexistent in 1988 but has become extensive following the U.S. invasion and occupation. Reason may prevail with more revisions to Iraq’s plans for production. Failing that, the next war in the Middle East could turn out to be Iran’s invasion of Iraq.
Saudi Arabia’s cuts in production that began in 1981 proved to be a futile effort to support the oil prices achieved during the 1979 revolution in Iran and Iraq’s invasion of Iran in September 1980. The means by which the clerical party achieved power in Iran 35 years ago were similar to those currently employed by Islamic State (ISIS), which seeks to establish an Islamic caliphate. ISIS is the extreme element of the Sunni revolt in Iraq and Syria. In practice, the conduct of oil matters (including OPEC) by the Islamic Republic of Iran has been about the same as the previous regime because circumstances and interests did not change. The only significant difference was the creation of the “buy back” contract for foreign participation.
Consistent with the Islamic Republic’s “us versus the world” mentality, the terms for foreign participation in Iran were the most onerous on offer in the world until the emergence of service contracts in Iraq in 2008. In 2011, crude oil production was only 2.8 million bbl/d versus the 5.2 million bbl/d produced in 1978 before the revolution. Sanctions by the United States and others subsequently reduced it to less than 2 million bbl/d. Amid the negotiations for relief, the stated goal is to reach 4 million bbl/d with foreign participation, but the announcement of revised terms keeps being postponed.
The Islamic Republic has been a tragedy for most citizens of Iran. Against long odds, should the Islamic State prevail, the same will be true for citizens of Iraq. The issue for the oil market, however, is whether foreign participation in Iraq’s industry continues. If not, Iraq could become another pariah state with declining oil production and a deteriorating economy. The “middle way,” of course, is Saudi Arabia. The Saudi regime is every bit as dogmatic and repressive as the Islamic Republic. Saudi Arabia does, however, employ all sorts of “infidels” (as defined by Muslims) in the country’s oil industry.

George S. Littell is a partner in Houston-based Groppe, Long & Littell, which provides analytical, forecasting and consulting services to the petroleum industry. Littell joined the firm in 1975 after nine years with Mobil Oil Corporation, interrupted by his service in the U.S. Army as an artillery officer in the 23rd Infantry (Americal) division in Vietnam. Littell is an advisory director of Barrier Resources, and has served as a director of Chenier Exploration and of Continental Resources Inc. After graduating from Yale University, Littell earned an M.B.A. from New York University and a law degree from La Salle Extension University. He is a member of the International Association for Energy Economics.
For other great articles about exploration, drilling, completions and production, subscribe to The American Oil & Gas Reporter and bookmark www.aogr.com.