


Gas Markets
LNG Exports Continue To Set New Records
According to the latest monthly data from the U.S. Energy Information Administration, July U.S. natural gas exports were the highest for any month since the agency began tracking monthly exports in 1973. Total exports were 12.6 billion cubic feet a day in July, an increase of 27.8% over the 9.9 Bcf/d exported during the same month last year.
“The increase in exports continues to be driven by liquefied natural gas,” EIA emphasizes in its Natural Gas Monthly report. “LNG exports in July were 60.2% higher than in July 2018. The United States exported 5.1 Bcf/d of LNG to 21 countries. The average daily rate of LNG exports was the highest for any month since EIA began tracking them in 1997.”
In July, for the 27th consecutive month, dry natural gas production increased year over year to 2.83 trillion cubic feet, or 91.3 Bcf/d. This was 9.5% higher than in July 2018, and also was the highest average daily rate for any month since EIA began tracking dry production in 1997. Consumption averaged 76.9 Bcf/d in July, which was 1.9% higher than in July 2018 and the highest level for the month since 2001, when EIA began using its current definitions for consuming sectors.
FIGURE 1
Global LNG Supply by Region (million tons)
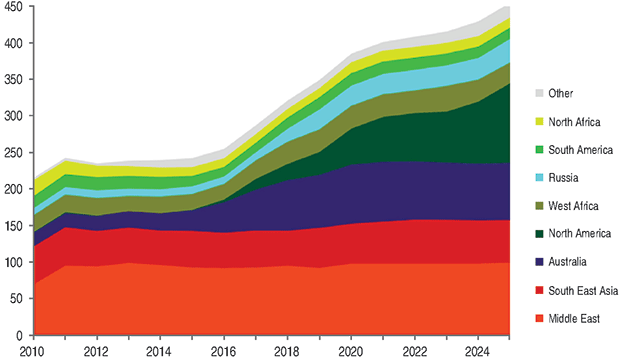
Source: Rystad Energy UCube, September 2019
Fueled by strong production growth, the United States is anticipated to lead international LNG capacity expansions and investments going forward with multiple projects coming on line by 2025, according to a report from Rystad Energy.
Figure 1 shows global LNG production split by region from 2010 to 2025. In 2018, there was 321 mtpa of LNG produced, an increase of 12% relative to 2017. To keep up with increasing LNG demand, global production is expected to continue to grow going forward, hitting 455 mtpa by 2025, according to the report.
Largest LNG Producer
About 65% of future LNG volumes will come from sanctioned projects, which includes increasing volumes from the United States and Australia. At present, the Middle East is the largest supplier of LNG with Qatar being the biggest contributor to the nearly 100 mtpa supplied by the region each year. North America, however, is anticipated to replace the Middle East as the largest LNG producer by 2025, Rystad says. With nearly inexistent LNG supplies before 2017, the United States is actively ramping up output on its key LNG projects, including Sabine Pass, Freeport and Corpus Christi.
“Over the next three years, the United States will add ~35 mtpa of LNG supply as projects start operations, and is set to flood the market with flexible volumes,” the report reads. “The majority of U.S. supply is contracted by portfolio players or traders, with the purpose of reselling the volumes.”
In addition to the U.S. ramp up, Australia’s Ichthys and Prelude projects are expected to reach full capacity next year, bringing total Australian supply to 80 mtpa. Russia also is emerging as an important LNG supplier with top companies aspiring to take a share in the global LNG market, Rystatd reports. Novatek’s operated Yamal LNG project is scheduled to reach full capacity in 2020 and several new projects, such as Arctic LNG 2, are anticipated to begin service in the next five years. Total Russian output is expected to reach 30 mtpa by 2025, with Russia entering the top five largest global LNG producers.
FIGURE 2
Breakeven Prices for New LNG Projects
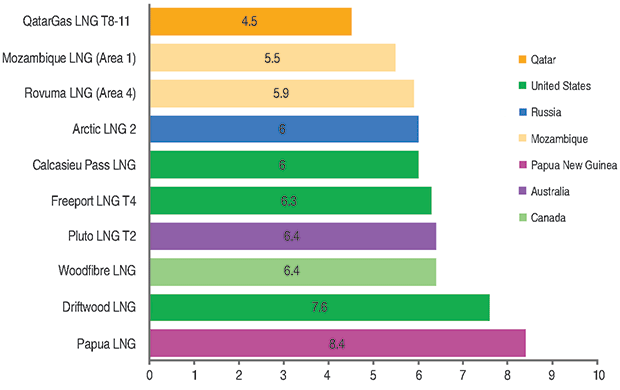
Source: Rystad Energy UCube, September 2019
Breakeven price includes feed gas, LNG capex, liquefaction opex and transportation cost to East Asia
Figure 2 shows breakeven prices for the upcoming LNG projects expected to be sanctioned over the next three years. In mid-August, Venture Global took the final investment decision on the $5.8 billion Calcasieu Pass project in Louisiana with breakeven price of $6.00/MMBtu. Area 1 LNG in Mozambique was sanctioned by Anadarko in June, and has an estimated breakeven price of $5.50/MMBtu. The first train of Woodfibre LNG in Canada, as well as Mozambique’s Area 4 (Rovuma) and Russia’s Arctic LNG 2, are also expected to reach FIDs soon. These projects are thought to break even at $6.00-$6.40/MMBtu.
Within the next two years, Rystad says it anticipates seeing the sanctioning of Driftwood LNG and Freeport LNG Train 4 in the United States, as well as Papua LNG, Pluto LNG Train 2 and QatarGas LNG Trains 8-11. QatarGas LNG has the lowest breakeven price among the top upcoming projects at $4.50/MMBtu. On the other hand, Papua LNG, with an estimated breakeven price of $8/MMBtu, is one of the more expensive projects, which combined with the political uncertainty surrounding the project, could mean sanctioning delays.
Dominating Position
Along with Mozambique, the United States dominates the new LNG project list. Moreover, Rystad notes that America is positioning itself for continued significant LNG export growth with the Federal Energy Regulatory Commission (FERC) approving a record number of LNG export projects in 2019.
The United States saw the largest injection of capital investment into LNG development projects over the past five years, and also is forecasted to lead global LNG capital spending on new unsanctioned projects over the next five years.
“Among these, Driftwood LNG is the largest development, and will see an average of around $2.5 billion invested yearly from 2021 to 2025,” the report states. “Currently, active investment is going into sanctioned, but not yet producing projects, including Freeport LNG and Golden Pass (both in the United States) and LNG Canada. Similarly, LNG investments in Russia are set to pick up again after the completion of Yamal LNG. Arctic LNG 2 project, the second Novatek operated project to be developed, will be the first to come online by 2025. Globally, LNG capital investments are forecast to reach 2014 levels again by 2025.
The addition of LNG export terminals and new pipeline capacity to deliver produced natural gas to them is expected to ultimately help reduce the volumes of natural gas flared and vented in onshore resource plays. In the third quarter, Permian Basin flaring and venting remained near record highs, averaging in the range of 600 MMcf to 650 MMcf a day, says Artem Abramov, head of shale research at Rystad Energy.
While the launch of the Gulf Coast Express pipeline is set to provide additional takeaway capacity in the fourth quarter, Abramov cautions: “It should be noted that the significant number of new well connections in the second half of 2019 might result in a sustained high flaring level, because from an operational perspective, associated gas flaring is normal in the first two weeks following an oil well completion.”
Outside of the Permian Basin, flaring and venting in the U.S. onshore sector is generally low. The exception is the Bakken/Three Forks plays in the Williston Basin in North Dakota. Data from North Dakota last summer showed that 22%-23% of produced gas was being flared, twice as much as the state would like to achieve under its current regulations.
“Such a high level of flaring has never been seen before. The volumes are high not only in absolute terms, but also corresponding to the record high flaring-to-production ratio in recent history,” Abramov notes.
For other great articles about exploration, drilling, completions and production, subscribe to The American Oil & Gas Reporter and bookmark www.aogr.com.