


Lower Tertiary Fracturing
Method Mitigates Offshore Fracturing Risk
By Seth Podhoretz and Peter Valko
COLLEGE STATION, TX.–The Lower Tertiary Wilcox formation the Gulf of Mexico is estimated to contain more than 25 billion barrels of oil, and there is a high degree of certainty in hydrocarbon presence considering the exploration success to date. However, at water depths approaching 10,000 feet, total formation depths to 30,000 feet and greater, and extreme temperatures and pressures, significant technological constraints limit well design, completion and production.
Commercial production requires high wellbore productivity to balance upfront initial cost, making hydraulic fracturing a potentially attractive completion method given the relatively low permeability and medium oil viscosity in these reservoirs. Unlike many producing formations in the Gulf, which are unconsolidated and high-permeability sandstones that generally require single-zone frac-and-pack completions, hydraulic fracturing for productivity improvement in the Lower Tertiary requires a new mindset.
Massive hydraulic fracturing is a costly operation, particularly in ultradeepwater fields where logistical constraints and high rig rates add significant financial risk. Cost estimates are uncertain, because nonproductive time is highly variable. For the Lower Tertiary, limited production from analogous fields coupled with monumental appraisal drilling costs result in huge uncertainty in key reservoir parameters and a lack of consensus on best practices for fracture design.
Recognizing that new tools and methodologies are needed to design and optimize hydraulic fracturing in this high-risk environment, a new approach has been developed for making strategic decisions regarding the number and dimensions of hydraulic fractures for a high-cost, high-risk offshore vertical well in formations such as the Lower Tertiary. Uncertainty is associated with reservoir characteristics, the economics of fracturing, and fracture height growth. Reservoir uncertainty is manifested in vertical permeability. Economic uncertainty exists in the total fracture treatment cost (which depends on the number of stages). Design uncertainty includes fracture height growth prescribed by a given aspect ratio.
The developed method is applicable to vertical wells with multiple, partially penetrating fractures in a thick anisotropic formation when considerable uncertainty in reservoir parameters amplify the financial risks associated with water depth and remoteness.
Two-Stage Stochastic Program
The method applies a utility framework to account for financial risk, and the optimization problem is represented as a two-stage stochastic program with simple recourse. Specifically, it applies the distributed volumetric source (DVS) method, an efficient semi-analytical model to determine the pressure response and productivity of partially penetrating (height and half length) fractures in anisotropic media. The flexibility of this method, and its computational robustness, are vital for sensitivity analysis and optimization purposes. The pressure response from the reservoir combined with the oil material balance yields the production profile.
This nonlinear stochastic programming framework for optimizing a multistage fractured vertical well under uncertainty is presented as a two-stage stochastic program with simple recourse (meaning second-stage decisions are automatic and serve as a penalty based on first-stage decisions). The utility framework is applied for risk quantification and optimization, applying a conservative risk profile using an exponential utility function. The utility is dimensionless and monotonic. The actual value has no physical or economic meaning, and its use is restricted to comparative purposes.
In deterministic optimization, the optimal number of fracture stages and individual fracture dimensions for a vertical well are determined for a fixed set of economic and physical parameters. The objective function is net present value (NPV) or a similar indicator. The objective is to find the optimum tradeoff between the number of fracture stages and the competing individual fracture size (characterized by half-length), vertical penetration and width.
In stochastic optimization, the number of stages and individual sizes are determined for an uncertain set of economic and physical parameters. Uncertainty is represented by discrete probability distributions. The objective is to find the optimum tradeoff between the number of fracture stages, fracture half-length, width and vertical penetration under uncertain economic and reservoir conditions. The objective function is expected NPV.
For any given realization of random variables, there is deterministic optimal design. However, there is no reason to believe that this will yield the highest expected value even when using an average of the random variables. This is the motivation of stochastic optimization to maximize the expected outcome over all possible realizations by selecting a design that minimizes the loss when realizing unfavorable outcomes. For the stochastic optimization explicitly considering risk, the utility function is applied as a linear transformation of NPV. For our purposes, risk is considered a conservative utility in the form of the exponential utility function.
In a relatively thick homogenous formation, a fracturing aspect ratio of 1 can be expected, where the total fracture length (two half-lengths) equals fracture height. However, limited public data available from well completions work on the Petrobras-operated Cascade/Chinook Field shows an aspect ratio of 2, where the fracture half-length equals fracture height. Uncertainty in fracture height growth in a highly anisotropic formation has profound implications on wellbore productivity.
For this optimization, the total amount of proppant per well is constant. This represents a physical limit on the integrity of completion and service equipment subject to abrasive damaging from high proppant injection rates. This constraint is highly dependent on currently technology and can change rapidly. A consequence of this constraint is that as the number of stages increases, the individual fracture half-lengths and heights decreases while the total height penetration of the formation increases.
The overall vertical penetration is summation of the individual fracture heights. In effect, increasing the number of stages simply bypasses the aspect ratio constraint and allows for a more theoretically optimal design. The minimum allowable fracture width was set at 1 proppant grain diameter (30/60 bauxite) and the maximum allowable width was set at 10 proppant grain diameters. The research assumed that an optimal fracture number (and dimensions) occurs when all the proppant remains inside the reservoir.
Input Data
TABLE 1
Example Lower Tertiary Properties
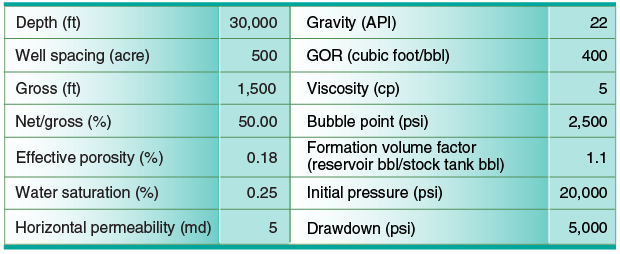
Table 1 shows the deterministic inputs for the formation, wellbore and frac operations. The formation depth, oil gravity and gas-to-oil (GOR) ratio significantly impact reservoir abandonment pressure (vertical lift requirement in the preliminary analysis resulted in a reservoir abandonment pressure of 12,000 psi). An important characteristic is the rather high drawdown of 5,000 psi. This is generally much higher than in Gulf Miocene and Outer Shelf plays. However, this drawdown is consistent with publicly available Lower Tertiary well test data.
The stochastic reservoir inputs for this analysis were vertical permeability and fracture height growth. For simplicity, uniform distributions were used to demonstrate the value of stochastic programing. At first glance, the vertical/ horizontal permeability ratio of 1/1,000 may seem unrealistic, but the vertical permeability is “effectively zero” in the Cascade/Chinook Field, according to published data.
It is important to note subtle, yet distinct characteristics of fracture performance in a thick anisotropic reservoir with partial vertical penetration. These include the effect of partial vertical penetration (fracture height less than formation thickness) on dimensionless productivity at various possible anisotropy ratios. With respect to transient and pseudo-steady state behavior, low vertical permeability and limited vertical fracture coverage mean that the vertical boundary may be reached later than the horizontal one.
The importance of including the transient behavior of the dimensionless productivity is not trivial. Using only the pseudo-steady-state productivity may underestimate wellbore performance at early absolute times for high levels of anisotropy and low vertical fracture penetration. For subsequent optimization purposes, when considering the risk and cost of additional stages, disregarding the transient behavior could incorrectly bias the design, forcing more vertical penetration when in reality it may not be needed.
Furthermore, assuming fracture height growth follows a prescribed aspect ratio, it may be impossible to achieve the optimal dimensionless productivity index as given by the unified fracture design (UFD) method. Assuming a fixed aspect ratio, fracture height is intrinsically linked to the half-length and subsequently to average width for a given proppant mass. Consequently, the effect of finite conductivity in the fracture directly competes against the effect of partial penetration of the reservoir thickness.
Risk Analysis
FIGURE 1A
Markov Chain of NPT Time
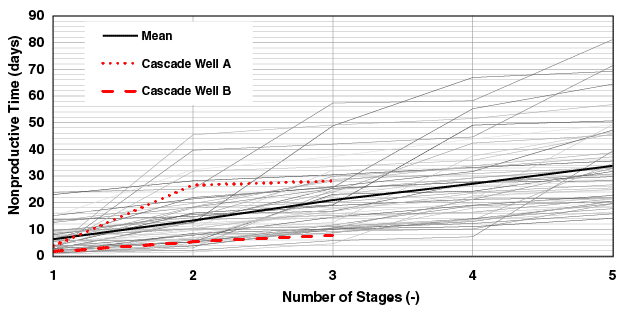
FIGURE 1B
Probability Distribution of NPT Time
Although multistage hydraulic fracturing to enhance productivity is common onshore with well-understood financial risks, applications in ultradeep water are subject to significant risk as a result of the hostile operating environment and the extreme costs involved. Proppant cost is nearly insignificant compared to the total cost of drilling and completing an offshore well, but the risks associated with multistage fracturing in the Lower Tertiary are paramount, since any nonproductive time could result in millions of dollars of added cost.
For future analysis and forecasting, data from SPE 147313, a technical paper presented at the Society of Petroleum Engineers’ 2011 Annual Technical Conference & Exhibition was used to generate Markov Chain of completion time with respect to number of stages (also see “Cascade/Chinook Operations Show STMZ Systems’ Viability In Completing Lower Tertiary Wells,” by K. Scott Ogier, et al., AOGR, June 2012, page 118).
The Markov chain represents an independent transition from one state to the next. Assuming a log normal distribution using data from two Cascade wells, a series of Markov chains was generated to predict nonproductive time associated with fracturing additional stages (Figure 1A). These realizations were then used to generate probability density curves representing the time associated with fracturing additional stages (Figure 1B).
The results can be used in determining the expected value and standard deviation of total (productive plus nonproductive) times associated with fracturing additional stages. Not surprisingly, with increasing number of stages, the location of the peak moves to the right, but the spread of the curves grows even faster.
Deterministic Optimization
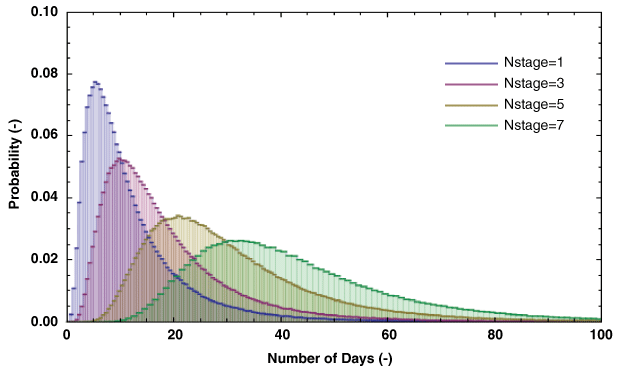
FIGURE 2A
NPV versus Number of Stages to Fracture (Aspect Ratio = 1)
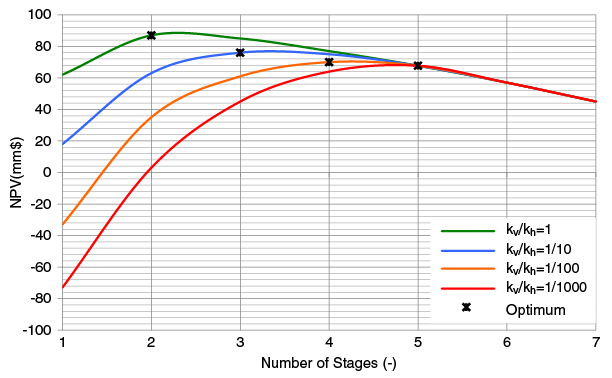
FIGURE 2B
Dimensionless Productivity versus Number of Stages to Fracture (Aspect Ratio = 1)
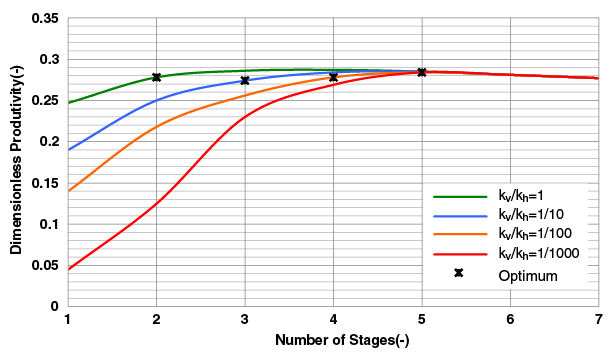
Various cases of fracture height growth were investigated as part of the deterministic optimization process to identify the optimal number of stages for a vertical well in an anisotropic formation subject to fracture height constraints. The objective function is the maximization of NPV, with the number of stages the decision variable.
The first situation investigated was for an aspect ratio of 1 (2 fracture half-lengths = fracture height). The NPV and dimensionless productivity are graphed in Figures 2A and 2B.
There are an optimal number of stages for different levels of reservoir anisotropy. Where vertical permeability (kv)/horizontal permeability (kh) is 1, the optimal number of stages is two. The stage number increases to three for kv/kh = 1/10, four for kv/kh = 1/100, and five for kv/kh = 1/1,000. As anisotropy increases, the number of stages increases, the fracture half-length decreases and the individual fracture height decreases, while total vertical penetration increases.
FIGURE 3A
NPV versus Number of Stages to Fracture (Aspect Ratio = 2)
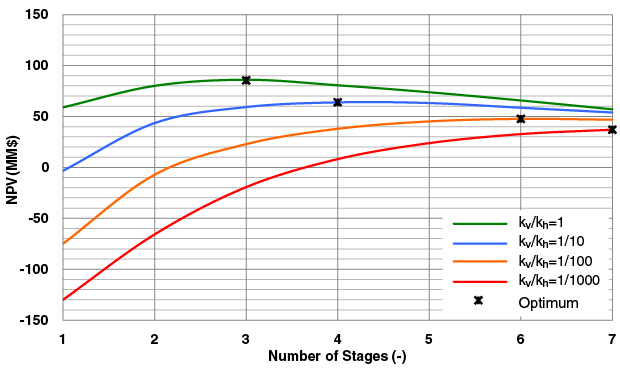
FIGURE 3B
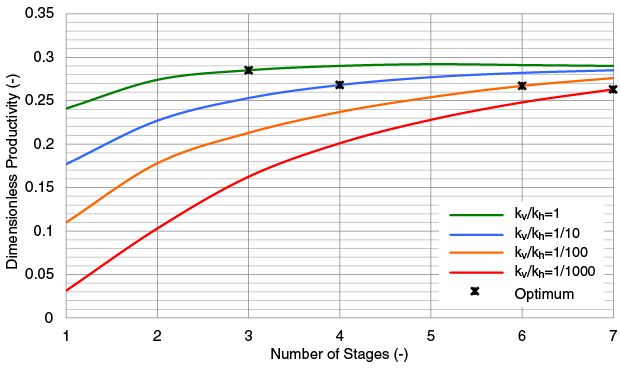
Dimensionless Productivity versus Number of Stages to Fracture (Aspect Ratio = 2)
Furthermore, fracture widths remain constant until the entire pay is fractured. For moderate proppant numbers, the optimal design always favors more vertical penetration with any level of anisotropy. Since vertical penetration is directly linked to half-lengths until the entire formation is penetrated vertically, the width (fracture conductivity) is compromised.
The next situation investigated was for an aspect ratio of 2. Figures 3A and 3B show the NPV and dimensionless productivity. Again, there are a distinct optimal number of stages for any given ratio of reservoir anisotropy, ranging from three stages for kv/kh = 1 to seven for kv/kh = 1/1,000. The results differ significantly from the case in which the aspect ratio was 1. The fracture propagates more in the horizontal direction, which impacts total wellbore performance since it takes more stages to cover the entire interval. In fact, even after seven stages, overall vertical penetration is significantly less than unity.
For this aspect ratio, the effect of anisotropy is much more severe. Because of the limited height penetration for a single fracture, more stages are needed, increasing costs and decreasing NPV.
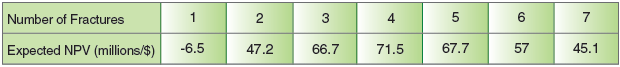
FIGURE 4
Expected NPV versus Number of Stages to Fracture (Aspect Ratio = 1)
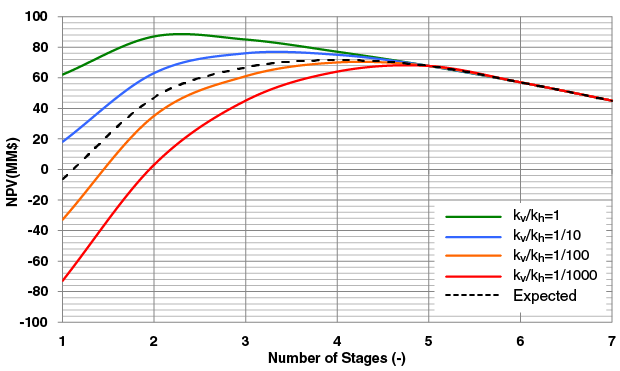
TABLE 2
Expected NPV Results (Aspect Ratio = 1)
Stochastic Optimization
After summarizing the deterministic optimization for various ratios of vertical to horizontal permeability and two aspect ratio values for the created fracture, the next step in the analysis was to consider uncertainty in the actual values of vertical permeability.
Figure 4 shows the NPV for different vertical permeabilities as well as the expected NPV with an aspect ratio of 1. Table 2 lists the expected NPV for each stage. Recalling the deterministic results, each realization of vertical permeability would require a different number of fracture stages (from two to five as anisotropy increased). Considering the uncertainty in each realization, the optimal number based on expected NPV was determined to be four.
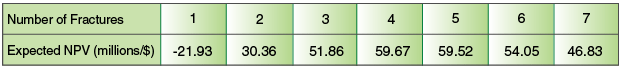
Figure 5 shows the NPV for various vertical permeabilities as well as the corresponding expected NPV using as aspect ratio of 2. Table 3 lists the NPV for each stage. Again, in the deterministic case, each permeability realization had an optimal number of stages from three to seven. Considering the uncertainty in each realization, the optimal number of stages was determined to be five.
FIGURE 5
Expected NPV versus Number of Stages to Fracture (Aspect Ratio = 2)
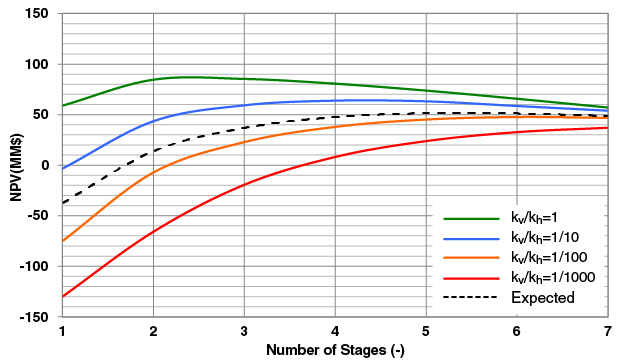
TABLE 3
Expected NPV Results (Aspect Ratio = 2)
When considering uncertainty, the actual optimal number of stages falls in between the best- and worst-case scenarios. However, the expected NPV was used as an objective function. Even when designing for the expected outcome, only one realization will actually occur (i.e., designing five stages could result in any of four possible NPV outcomes). For nonrepeatable situations, or when certain targets must be met, imposing a conservative risk profile may be warranted. This can be systematically achieved by applying the utility formulation.
In this case, the utility was incorporated using a “very conservative” risk profile (r = 50). The optimal number of stages will not be different from the case when NPV was the objective function (ranging from three to seven stages depending on the reservoir anisotropy ratio). This is expected, since the optimization is still deterministic at this point and the utility changes monotonically with NPV. However, under uncertainty, maximizing the expected utility results in a different number of stages. For the r = 50 risk profile, the optimal number of stages was six. In effect, the conservative utility increased the number of stages and reduced the overall risk, while maintaining reasonable expected NPV.
Cost Uncertainty
The Markov chains and probability density function yielded a reasonable quantification of the risk associated with the increased number of stages. Using the expected NPV and applying the utility function to directly quantify risk, the utility per stage associated with completion cost risk was determined.
FIGURE 6A
Facture Cost Uncertainty versus Reservoir Uncertainty (Aspect Ratio = 2)
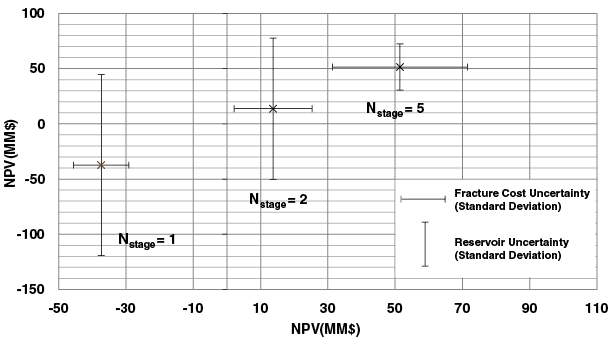
FIGURE 6
Facture Cost Uncertainty versus Reservoir Uncertainty (Aspect Ratio = 1)
In considering the completion cost uncertainty, maximizing the utility generally resulted in a lower number of fractures. This is the case for kv/kh = 1, 1/10 and 1/100, in which each individual optimum number of stages is less than the optimum given by NPV criteria. This is intuitive, since reducing the number of stages decreases risk. However, for kv/kh = 1/1,000, the optimum number of stages is seven (same as in the case of expected NPV optimization). This is reasonable considering that there are such significant losses in wellbore productivity at low vertical penetration for that anisotropy level, that even with reduced risk tolerance, the best decision is to fracture “as much as possible.”
In these examples, uncertainty had a profound effect on decision making. When considering reservoir risk (vertical permeability variation), risk analysis favored more fracture stages to ensure sufficient vertical penetration. When considering economic risk (completion time uncertainty), however, the stochastic analysis favored less fracture stages to prevent excessive cost in the form of nonproductive time.
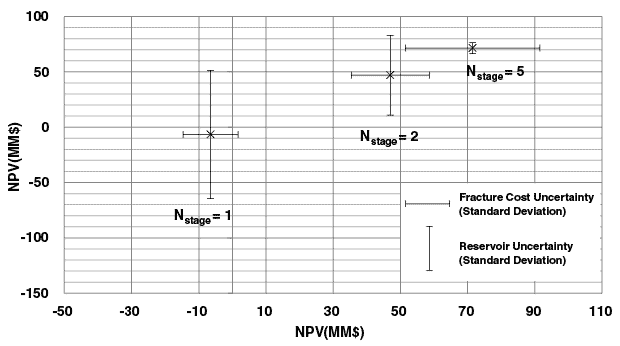
The next step in stochastic optimization was considering reservoir and cost uncertainty simultaneously. It is useful to graph the effect of the fracturing cost and reservoir uncertainty on NPV. Figures 6A and 6B show the effects for aspect ratios of 2 and 1, respectively. With a low number of stages, fracture cost risk is minimal, but reservoir risk is high. As the number of stages increases, fracturing risk increases while reservoir risk decreases. If the reservoir risk is solely variations in vertical permeability, the risk may be eliminated entirely when the entire zone is fractured. For any given situation, the optimal solution will depend on the range of uncertainties associated with each risk.
FIGURE 7
Reservoir and Cost Uncertainty Utility versus Number of Stages to Fracture (Aspect Ratio = 2)
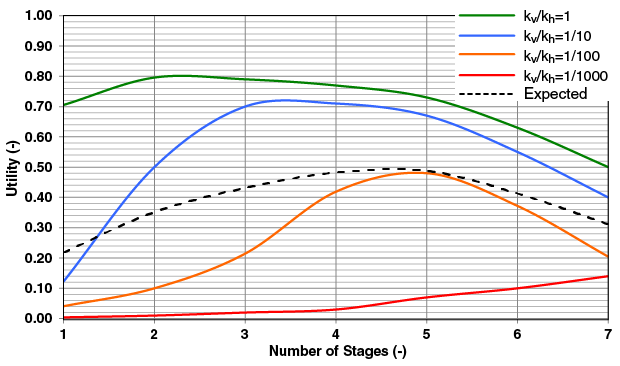
TABLE 4
Reservoir and Cost Uncertainty Utility Optimization Results (Aspect Ratio = 2)
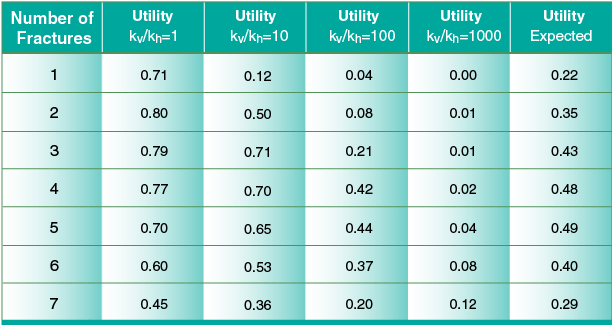
Figure 7 and Table 4 show the expected utility results for an aspect ratio of 2 and a conservative risk profile (r = 20). Considering both reservoir and completion cost uncertainty, a new optimum is found at five stages. Not surprisingly, this is a further compromise. The optimum stage number is generally higher than when considering only operational cost risk, but generally lower than when considering only reservoir risk.
Fracture Height Uncertainty
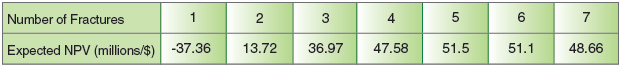
The final case considered fracture height uncertainty as well as reservoir uncertainty. For this case, fracture height growth followed either an aspect ratio of 1 or 2, with equal likelihood. This does not mean there will be “all kind of fractures,” but that if the reservoir’s preferred aspect ratio is 1 in a given stage, it will be the case in all stages. Figure 8 and Table 5 show the expected NPV for each aspect ratio realization and conditional expectation for all permeability realizations.
FIGURE 8
Expected NPV versus Number of Stages to Fracture for Fracture Height Uncertainty
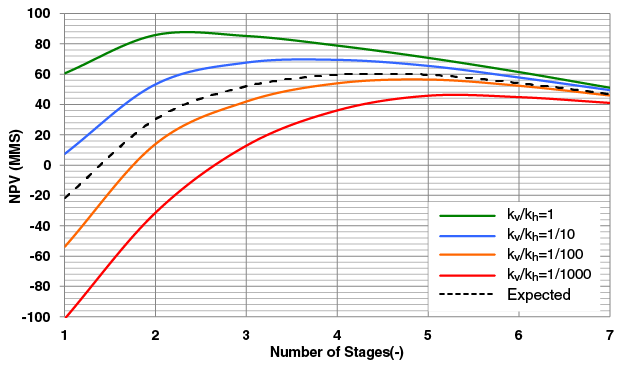
TABLE 5
Fracture Height Uncertainty/Expected NPV Optimization Results
Considering fracture height growth and vertical permeability uncertainty simultaneously, an optimal number of stages was determined for each permeability realization. The conditional expectation was then taken over all permeability realizations to arrive at the optimal number of stages for both height and permeability uncertainty. The optimal number of stages for this case was four. Again, to account for the risk, the utility theory was applied. Simultaneously accounting for both reservoir (anisotropy) and fracture (aspect ratio) uncertainty, the optimum was five. By increasing the number of stages, the reservoir risk was mostly compensated and the range of outcomes was tightened.
The analysis provided interesting insights. When reservoir permeability was a risk, the design favored more stages. When completion cost was a risk, the design favored fewer stages. There was no general trend when fracture growth was uncertain, with the design favoring more stages in some cases and fewer in other cases.
The analysis also hinted a more general aspect of design under uncertainty: how decisions affect overall uncertainty. When the reservoir permeability was the risk, adding more stages reduced or even eliminated it. The economic risk, although seemingly out of the grasp of engineering, can be managed with best practices and increased learnings. The same cannot be said for fracture height growth risk. No matter what decision one makes, there is no way of eliminating that risk. All that can be done is to design for the best expected outcome, or use more “out-of-the-box” thinking, such as spending more on information that can reduce the uncertainty.
In essence, this analysis allows assigning value to information. The differences in outcome (NPV) of the possible realizations can be directly used to justify further spending on information. Of course, one must be sure that the additional information will indeed reduce uncertainty. it comes as no surprise that such information is more valuable (or the lack of it is more detrimental) in an offshore development than in traditional onshore environments.
Editor’s Note: The authors acknowledge Robert H. Lane, adjunct professor at Texas A&M University, for supporting the research. For more detailed information on the methodology and results referenced in this article, see OTC 25179, a technical paper originally prepared for presentation at the 2014 Offshore Technology Conference, held May 5-8 in Houston.

Seth Podhoretz is a reservoir engineer at BHP Billiton in Houston, responsible for supporting the company’s onshore unconventional production assets, including the Eagle Ford, Permian, Haynesville and Fayetteville. He joined BHP Billiton in 2013 as a production engineer leading production operations and reservoir surveillance in the Haynesville Shale. Podhoretz served as a production engineer intern at BHP Billiton in the summer of 2012, where he analyzed sanctioned projects in the Lower Tertiary. He holds a B.S in chemical engineering from Brown University and an M.S. in petroleum engineering from Texas A&M University, with his master’s thesis focused on the stochastic programming approach to Lower Tertiary hydraulic fracturing.

Peter Valko is the Robert L. Whiting chair in petroleum engineering at Texas A&M University. His research interests include the performance of stimulated wells, designing and analyzing hydraulic fracturing treatments, and numerical inversion of the Laplace transform. Valko joined Texas A&M’s faculty in 1993 as a visiting associate professor and research scientist after serving as an assistant professor at the Institute of Drilling and Production at the Mining University of Leoben in Austria. He holds a B.S. equivalent in chemical engineering and an M.S. equivalent in applied mathematics from Veszprem University in Hungary, and a Ph.D. equivalent from the Institute of Catalysis in Russia.
For other great articles about exploration, drilling, completions and production, subscribe to The American Oil & Gas Reporter and bookmark www.aogr.com.