


U.S. Exports
Natural Gas and Oil Exports Set Records
WASHINGTON–A week before Thanksgiving, the Federal Energy Regulatory Commission announced the approval of four new liquefied natural gas projects and related facilities to export U.S. natural gas.
All four projects are located in South Texas, with three of them situated along the deepwater Brownsville Ship Channel in Cameron County:
- NextDecade Corp.’s Rio Grande export terminal includes six liquefaction trains with a combined capacity of 27 million tons per annum (mtpa). It includes the Rio Bravo Pipeline that will transport 4.5 billion cubic foot a day of Permian Basin associated gas from the Agua Dulce area to the Rio Grande facility. NextDecade says a final investment decision is expected in the first quarter of 2020.
- Texas LNG’s proposed terminal has a capacity of 4.0 mtpa, scheduled to be constructed in two phases with each phase adding 2 mtpa. According to the company, a final investment decision is expected in 2020 with planned first LNG production in 2024.
- Annova LNG’s facility has the capacity to export 6.0 mtpa of LNG. It also is expected to commence operations by 2024.
The fourth project is an expansion of Cheniere Energy’s terminal at Corpus Christi, Tx., which began operations at the end of 2018. Cheniere says Stage III of development at Corpus Christi will add seven midscale liquefaction trains with a total aggregate expected capacity of 11.45 mtpa. The project is expected to receive a FID in 2020.
According to FERC, all four LNG project sponsors have applications pending before the U.S. Department of Energy seeking authorization to export gas to countries without free trade agreements with the United States. This would allow exports to both FTA and non-FTA nations.
The Commission reports that these four project approvals come in the wake of its approval earlier this year of seven other U.S. export projects: Calcasieu Pass, Driftwood LNG, Port Arthur LNG, Gulf LNG, Eagle LNG Partners Jacksonville, Venture Global Plaquemines LNG, and Freeport LNG’s Train 4 expansion.
“I’m very proud of the hard work that the Commission and its staff have undertaken to continue our processing of LNG applications,” FERC Chairman Neil Chatterjee said in a statement. “The Commission has now completed its work on applications for 11 LNG export projects in the past nine months, helping the United States expand the availability of natural gas for our global allies who need access to an efficient, affordable and environmentally friendly fuel for power generation.”
Natural Gas Exports
According to the U.S. Energy Information Administration, a total of 1.61 trillion cubic feet of domestically produced natural gas was exported as LNG in the month of September, the latest month for which data is available. That was 99% higher than the amount of LNG exported in September 2018 and more than triple the volume exported in September 2017. Through the first nine months of 2019, the top destinations for U.S. LNG exports were Spain, Japan, India, South Korea and Mexico.
In September, total U.S. natural gas exports averaged 13.2 Bcf/d, the highest for any month since EIA began tracking monthly exports in 1973. Most U.S. natural gas trade is still transported by pipeline to Mexico and Canada, but LNG accounted for 5.4 Bcf/d a day–also a new record–with U.S. cargoes delivered to 22 countries.
Overall, U.S. exports of LNG jumped 60% percent through the first nine months of 2019 compared to the same period a year earlier, EIA statistics show. The agency reports that it expects LNG exports to average 4.7 Bcf/d in 2019 and 6.4 Bcf/d in 2020. As new liquefaction terminals and expansions of existing facilities come online, EIA projects that U.S. LNG export capacity will reach 9.6 Bcf/d within the next 24 months.
By the start of the fourth quarter, six U.S. LNG export projects were in operation: Cheniere Energy’s Sabine Pass (Louisiana) and Corpus Christi terminals, Dominion Energy’s Cove Point in Maryland, Freeport LNG in Texas, Cameron LNG in Louisiana, and Elba Island LNG in Georgia. Two other projects–Golden Pass in Texas and Calcasieu Pass in Louisiana–began construction in 2019 and are expected to be online by 2025, EIA reports.
Two new liquefaction trains came online in the first half of 2019: Cameron’s Train 1 in Louisiana and Corpus Christi Train 2. Cameron became the fourth U.S. export facility placed into service since February 2016 when it shipped its first cargo in May, and ramped up operations in late summer, according to EIA. Corpus Christi Train 2 shipped its first cargo in July and reached substantial completion in September. The first train at Freeport LNG and the first 10 small-scale trains at Elba Island came online in late 2019. These two new facilities, along with the completion of the Cameron facility, will increase U.S. LNG export capacity to 8.9 Bcf/d by the end of 2020, EIA reports.
FIGURE 1
U.S. Natural Gas Production (MMcf/day)
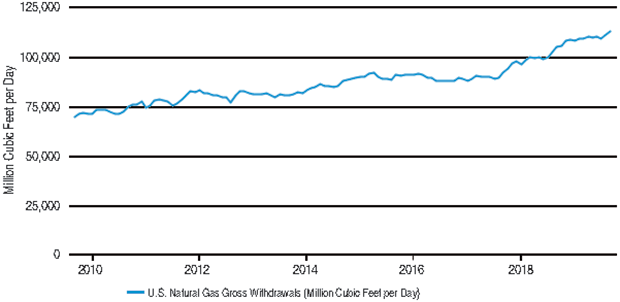
At the same time, net pipeline exports to Mexico have increased to record levels thanks to growing U.S. production (Figure 1) and the startup of new infrastructure projects, including the Texas-Tuxpan pipeline that is transporting gas from the Permian Basin to demand centers in Mexico. According to EIA, net natural gas exports are expected to continue to rise as additional LNG export capacity comes online and additional pipeline infrastructure in Mexico is placed into service. The agency projects that net exports will average 4.6 Bcf/d in 2019 and 7.2 Bcf/d in 2020.
Crude Oil Exports
Exports of U.S. crude oil are also reaching unprecedented heights. EIA data show that the United States exported 90,000 barrels a day more total crude oil and petroleum products in September than it imported, marking an historic moment in the modern history of U.S. oil trade.
“This is the first month recorded in U.S. data that the United States exported more crude oil and petroleum products than it imported,” the agency stated in its December Short-Term Energy Outlook. “U.S. imports and exports records of crude oil and petroleum products started on an annual basis in 1949 and on a monthly basis in 1973.”
EIA says that it expects total crude oil and petroleum net exports to average 570,000 bbl/day in 2020 compared with average net imports of 490,000 bbl/day in 2019. The top destinations for U.S. crude oil exports through the first nine months of 2019 were Canada, South Korea, India, the Netherlands and the United Kingdom.
FIGURE 2
U.S. Crude Oil Production (1,000s bbl/day)
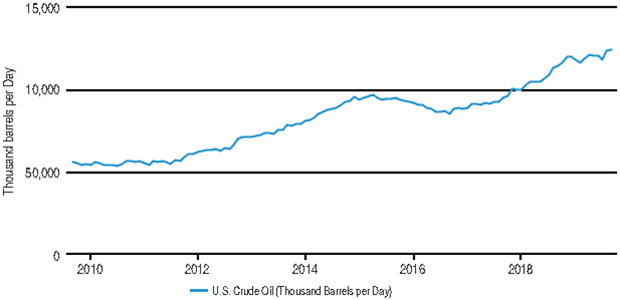
Despite the decline in drilling activity over the past several months, EIA forecasts that U.S. oil production will continue to grow as rig efficiency and well-level productivity rises, offsetting the decline in the number of active rigs (Figure 2). It forecasts that production will average 13.2 million bbl/day in 2020, an increase of 0.9 million bbl/day compared with 2019.
“Expected 2020 growth is slower than 2018 growth of 1.6 million bbl/day and 2019 growth of 1.3 million bbl/day,” the Short-Term Energy Outlook reads. “Slowing crude oil production growth results from a decline in drilling rigs over the past year that EIA expects to continue into 2020.”
Beginning on Jan. 1, the International Maritime Organization (IMO) is set to enact Annex VI of the International Convention for the Prevention of Pollution from Ships, which lowers the maximum sulfur content of marine fuel oil used in ocean-going vessels from 3.5% of weight to 0.5%. EIA says it expects that starting in the fourth quarter of 2019, this regulation will encourage global refiners to increase refinery runs and maximize upgrading of high-sulfur heavy fuel oil into low-sulfur distillate fuel to create compliant bunker fuels.
“EIA forecasts that U.S. refinery runs will rise by 3% from 2019 to a record level of 17.5 million bbl/day in 2020, resulting in refinery utilization rates that average 93% in 2020. EIA expects one of the most significant effects of the regulation to be on diesel wholesale margins, which rise from an average of $0.45 per gallon in 2019 to a forecasted peak of $0.61/gallon in the first quarter of 2020 and an average of $0.57/gallon in 2020,” the agency states in a report.
Finally, EIA reports that the share of total U.S. utility-scale electricity generation from natural gas-fired power plants will rise from 34% in 2018 to 37% in 2019 and to 39% in 2020. That compares to its forecasts of coal’s share of the of total utility power generation market to slide from 25% in 2019 to 22% in 2020, and renewables’ share (wind, solar and other non-hydropower sources) to grow from 10% in 2019 to 12% in 2020.
For other great articles about exploration, drilling, completions and production, subscribe to The American Oil & Gas Reporter and bookmark www.aogr.com.