


Gas Demand
Natural Gas Power Burn On The Rise This Winter
WASHINGTON–The first month of 2020 was one of the warmest in four decades, yet U.S. power burn reached 34 billion cubic a day on Monday, Jan. 20. That ranked as the second highest single-day consumption total recorded during any winter month, according to the U.S. Energy Information Administration.
Natural gas demand for electricity generation has traditionally been highly seasonal, peaking during the hottest summer months and ebbing during the coldest winter months. However, EIA says natural gas consumption for power generation averaged 28.4 Bcf/d from the start of November to the end of January, representing a 3 Bcf/d (12%) increase compared with the same period last fall and winter.
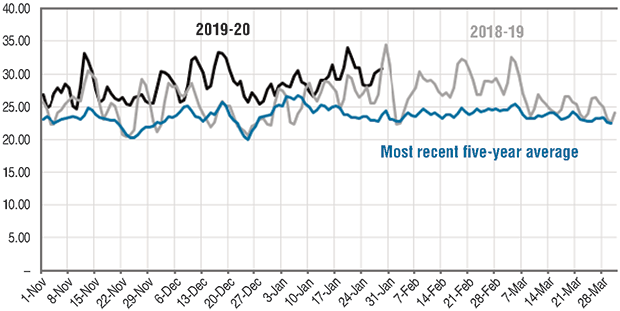
Figure 1 shows the amount of power burn this winter compared with last winter and the five-year average trend lines. EIA reports that increased consumption in the electric generation markets is being driven by a number of factors, including:
FIGURE 1
Natural Gas Consumption in Lower-48 Power Generation (Bcf/d)
- Nearly 27,500 megawatts of new natural gas-fired capacity added in 2018 and 2019;
- The retirement of 12,387 megawatts of coal-fired generating capacity in 2019 (the third-highest amount of any year since 2010);
- Alleviated gas pipeline congestion;
- Low Henry Hub spot prices; and
- Plentiful storage volumes.
Working gas stocks started the heating season at 3.7 Bcf at the end of October, which was 527 Bcf higher than at the same time in 2018 but the third lowest start-of-winter total since 2009. However, because of the unusually mild weather across virtually all the lower-48, inventory levels at the midpoint of the heating season were at their highest levels since 2015-16.
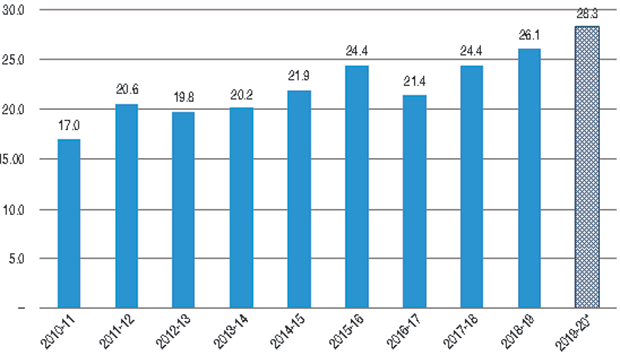
As shown in Figure 2, average daily wintertime use of natural gas for power generation has been growing over the past decade, jumping from 17 Bcf/d in winter 2010-11 to an estimated 28 Bcf/d this winter despite the unseasonably mild weather. Natural gas usage in the power sector during the winter months is part of a general trend that saw average daily deliveries to power generators increase 14.3% in 2018 to 29 Bcf/d, accounting for 35% of all natural gas consumption that year, EIA points out.
FIGURE 2
Wintertime Natural Gas Consumption for Power Generation (Bcf/d)
Although some of the drivers behind the high level of power burn this winter are related to the warm weather and the low cost of supply, a separate study conducted by EIA suggests that using natural gas to generate electricity has long-term economic advantages Modeling the estimated cost of electricity for new generation facilities entering service in 2023, EIA found that only hydroelectric and geothermal had a lower total cost than advanced combined-cycle gas plants, even when targeted tax credits for renewables were included.
Record Production
In its January Natural Gas Monthly report, EIA says dry natural gas production in November increased year over year for the 31st consecutive month to 96.5 Bcf/d, setting a new record daily rate. November’s output was 7.4 Bcf/d higher than the 89.2 Bcf/d of dry gas produced in November 2018.
Meantime, natural gas consumption in November averaged 89.9 Bcf/d, down slightly from the 90.3 Bcf/d consumed one year earlier. Despite the year-over-year slide attributed to mild weather, however, consumption in November still ranked as the second highest for the month since EIA began using new definitions for consuming sectors in 2001.
Given the warm temperatures, residential deliveries of dry gas declined 9% in November, and commercial deliveries slipped 6.2% on a year-over-year basis. However, electric power deliveries were up 7.6% to 27.4 Bcf/d, which was the highest for any November on record. Total gas exports also shot up 30.2% compared with November 2018, averaging an all-time high 14.7 Bcf/d.
Liquefied natural gas continued to drive export growth, EIA notes, with LNG exports in November up by a whopping 75.9% compared with November 2018. In total, the United States exported 6.3 Bcf/d of LNG to 22 countries.
In a report issued on Feb. 3, EIA charted U.S. oil and gas production versus the total number of producing wells. The agency found that increased production in 2018 despite a decline in the absolute number of wells reflected advancements in technology, particularly improvements in drilling and hydraulic fracturing techniques.
Wells classified as “nonhorizontal” in the report decreased 10% from 935,000 in 2014 to 842,000 in 2018. Horizontal wells grew from 99,000 in 2014 (10% of the U.S. total producing well count) to 140,000 in 2018 (14% of total producing wells). While only 1% of vertical wells produced at least 100 bbl/d of oil in 2018, 32% of horizontal wells produced more than 100 bbl/d.
In the report, EIA grouped wells into 26 production volume brackets, ranging from less than one barrel of oil equivalent per day to more than 12,800 boe/d. Most U.S. oil and natural gas production comes from wells producing between 50 and 1,600 boe/d. In 2018, wells within this range accounted for 9% of all active wells, but generated 66% of total crude oil and 62% of total natural gas production.
For other great articles about exploration, drilling, completions and production, subscribe to The American Oil & Gas Reporter and bookmark www.aogr.com.