


U.S. Oil Update
Oil Production, Refining Output Hit New Heights
WASHINGTON–U.S. petroleum markets established records for oil production and refinery performance in August, with crude output hitting 10.8 million barrels a day and refining throughput reaching 18.1 MMbbl/d for the month, the American Petroleum Institute says.
In its September Monthly Statistical Report, API notes U.S. liquids fuel production remains up by more than 2.0 MMbbl/d year-over-year in August, and the United States continues to supply virtually all global oil demand growth and compensate for production losses from several members of the Organization of Petroleum Exporting Countries.
U.S. petroleum demand, led by motor gasoline, distillate and refinery feedstocks, grew 250,000 barrels a day from July to August, reaching 20.8 MMbbl/d, API describes, adding this was the strongest demand for any month since August 2007, and reflects solid economic growth, industrial activitand consumer confidence.
According to the report, while domestic markets remained strong, U.S. petroleum exports decreased for the second straight month. Moreover:
- Crude oil exports in August were down 400,000 bbl/d from July and 560,000 from June; and
- Refined product exports, at 4.8 MMbbl/d in August, decreased 160,000 bbl/d from July and 730,000 bbl/d from June.
U.S. petroleum exports fell 1.3 MMbbl/d between June and August at the same time in which U.S. petroleum imports increased more than 300,000 bbl/d, API notes. Consequently, the domestic petroleum trade balance backslid by 1.6 MMbbl/d, or 56 percent, within two months. While the increased imports reflected strong U.S. demand and refining activity, the report points out, the drop-off in exports likely was because of a shift in buying patterns among the nation’s trading partners. API poses that this appears to be a setback for the United States’ goal to achieve energy dominance.
Other highlights of the September report include:
- Gasoline demand notches its third-highest August since 1945;
- Strong trucking and marine shipping activities drive August distillate demand to its highest level since 2007;
- Jet fuel demand is strongest year-to-date since 2001;
- Residual fuel oil demand is the most volatile on record since 1936;
- U.S. natural gas liquids production was down slightly from July, but at 4.3 MMbbl/d, was still the highest ever recorded for the month August; and
- U.S. petroleum inventories are stable in the five-year range.
Increasing Demand
August U.S. petroleum demand, as measured by total domestic petroleum deliveries, was up by 1.2 percent from July and 2.9 percent compared with August 2017, API describes. Through the end of the summer driving season, the Monthly Statistical Report says the pace of annual growth reflects solid economic growth, industrial activity and consumer confidence. Year-to-date through August, petroleum demand was at its strongest since 2007, averaging 20.3 MMbbl/d, an increase of nearly 500,000 bbl/d over the first eight months of 2017.
West Texas Intermediate crude prices averaged $68.06 a barrel in August, a decrease of $2.92/bbl from July. By comparison, the report points out international Brent crude prices averaged $72.53/bbl, a drop of $1.91 from July. The difference of nearly $4.50/bbl between the two benchmarks widened from around $3.50/bbl, even as U.S. crude oil exports fell between July and August.
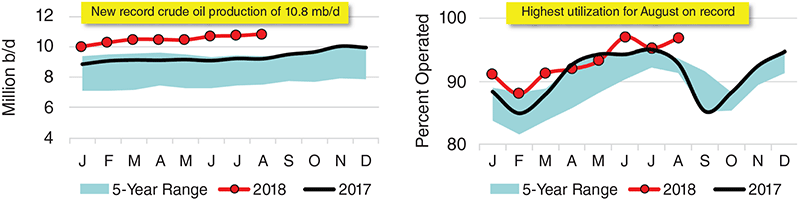
U.S. oil production and refinery capacity utilization both reached all-time records in August. U.S. petroleum demand and total petroleum deliveries also achieved their highest levels in 11 years, with demand hitting 20.8 MMbbl/d in August.
In August, gasoline prices fell by 1.4 cents a gallon from July, but remained 42.0 cents a gallon above those of August 2017, API says. Separately, with increased refining and petrochemical demand, natural gas liquids prices averaged $9.27 a million Btu in August, an increase of 5.7 percent from July.
Financial and physical fundamentals that affected global oil markets offered some highlights in August, the report indicates. A strong U.S. dollar generally has corresponded with lower oil prices, and in August the dollar neared its highest levels in a decade, following a 2 percent increase since the beginning of the third quarter and nearly 10 percent since late January, API says. The U.S. dollar’s strength may have helped ease prices despite what appeared to be a tighter global supply/demand balance by U.S. Energy Information Administration estimates.
The EIA’s August assessment of that global balance shifted from a projected surplus in July’s outlook to a slight deficit with demand outpacing supply throughout 2018, API says. Continued supply challenges have emerged abroad, with OPEC output declines in Venezuela and Angola, plus the impending renewal of sanctions against Iran.
Considering macroeconomic factors, API says the backdrop from petroleum demand and the end of the summer driving season appear to be solid in August.
Leading economic indicators point toward expanding business conditions, the agency offers, citing the Institute for Supply Management Purchasing Managers Index, which registered 61.3 in August. It notes any value above 50.0 suggests an expansion. Separately, the University of Michigan’s preliminary consumer sentiment index rose to 100.8 in September, the second highest of the year and the second highest since 2004. The survey’s chief economist, Richard Curtain, notes that consumers’ main concern is the effects of increasing tariffs, which have contributed to price inflation.
For other great articles about exploration, drilling, completions and production, subscribe to The American Oil & Gas Reporter and bookmark www.aogr.com.