


Market Update
Record LNG Exports Help Fortify Natural Gas Prices
WASHINGTON–On Oct. 22, the natural gas spot price at Henry Hub reached $3.00 per million British thermal units for the first time since March 2019, according to the U.S. Energy Information Administration. Driven by increasing liquefied natural gas exports and the start of wintertime heating demand, natural gas supply and demand balances began tightening in late October to provide a harbinger of market expectations in 2021.
“Increased demand for U.S. LNG exports has put upward pressure on the price at Henry Hub,” EIA says in its latest weekly report on the U.S. gas market. “Following a summer of LNG cargo cancellations and hurricane-related disruptions, LNG feed gas demand has recovered to pre-COVID levels.”
Since late August, LNG feed gas volumes have increased by more than 8.0 billion cubic feet a day, rising from 2.3 Bcf/d in the aftermath of Hurricane Laura, which made landfall on Aug. 27, to a record 10.4 Bcf/d by the end of October. The increase in LNG exports reflects a higher spread between the natural gas spot price at Henry Hub and the marker price for LNG spot cargoes delivered into Asian markets, which improves netbacks from LNG exports leaving the United States, EIA notes.
In its November Short-Term Energy Outlook (STEO), EIA estimates that the United States exported 7.2 Bcf/d of LNG in October on average. For November, it forecasts U.S. LNG exports will average above pre-COVID levels at 8.5 Bcf/d, and be maintained at 8.4 Bcf/d on average throughout 2021–a 31% year-over-year jump.
Cooler-than-normal temperatures in the second half of October, particularly in the Great Plains and Upper Midwest, also contributed to tightening market conditions by increasing natural gas heating demand. EIA says combined residential and commercial gas consumption increased from 8.3 Bcf/d on Oct. 10 to 27.0 Bcf/d by the end of October, and averaged nearly 2.0 Bcf/d higher in October 2020 than in October 2019.
Mild temperatures in early November, and resulting declines in residential and commercial consumption for space heating, led to a slight pullback in the Henry Hub prices, but EIA forecasts that higher prices are in the cards through the winter months and beyond. “Monthly average spot prices will remain higher than $3.00/MMBtu throughout 2021, averaging $3.14/MMBtu for the year, up from a forecast average of $2.14/MMBtu in 2020,” the agency states in the November STEO.
Demand Projections
Total U.S. consumption is projected to average 83.7 Bcf/d for full-year 2020, down only 1.7% from 2019. However, EIA says total consumption will average 79.4 Bcf/d in 2021 as a result of rising natural gas prices reducing 2020’s record demand levels for natural gas power burn in the electric generation sector.
Residential consumption for the 2020-21 winter season is projected to average 21.1 Bcf/d (5%) higher than last winter because of both forecasts for colder temperatures this winter and more people working and schooling from home. EIA predicted that propane consumption for residential space heating also will be 5% higher compared to last winter. Based on a colder weather forecast from the National Oceanic & Atmospheric Administration, EIA expects this winter to average 602 heating degree days (HDDs), which is nearly equal to the average of the previous 10 winters and 5% more HDDs than winter 2019-20.
Total U.S. working natural gas in storage ended October at 3.92 trillion cubic feet, 5% more than the five-year average and the second highest start-of-heating-season level on record. However, EIA anticipates that inventory draws will outpace the five-year average during the November-to-March winter months, leaving end-of-March storage 16% below the five-year average at 1.5 Tcf.
Energy-related carbon dioxide emissions fell 3% in the United States in 2019 thanks to the changing mix of fuels used to generate electricity, namely natural gas displacing coal-fired capacity, according to EIA.
After rising by 3% in 2018, EIA found that total energy-related CO2 emissions in 2019 were about 150 million metric tons (MMmt) lower year over year. In the electric power sector, which accounted for nearly one-third of total U.S. energy-related CO2 emissions, emissions from coal fell by 15% (177 MMmt) in 2019. While emissions from natural gas increased by 7% (40 MMmt) as a result the increase in gas-fired power burn, fuel switching to natural gas has generated significant reductions in CO2 emissions, the agency said.
“U.S. electric power sector emissions have fallen 33% from their peak in 2007 because less electricity has been generated from coal and more electricity has been generated from natural gas (which emits less CO2 when combusted) and non-carbon sources,” EIA stated in its annual U.S. Energy-Related Carbon Dioxide Emissions report. “U.S. total energy-related CO2 emissions have fallen 15% since their 2007 peak.”
Production Trends
Meantime, dry natural gas production in October was down 6.7 Bcf/d since the start of the year, falling to an average of 87.6 Bcf/d. For the week of Nov. 5-11, dry gas production averaged 88.4 Bcf/d, a decline of 6.6 Bcf/d from the same week a year ago. EIA forecasts that dry production will fall from a record 97.0 Bcf/d in December 2019 to 87.0 Bcf/d by April 2021 before increasing slightly to an annual average of 87.9 Bcf/d (Figure 1).
FIGURE 1
U.S. Marketed Natural Gas Production (Left) and Supply Sources (Right)
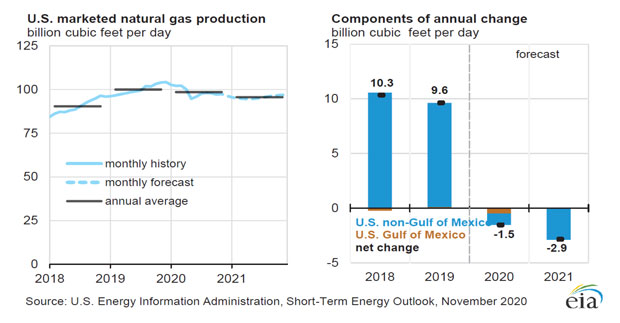
“EIA expects production to begin rising in the second quarter of 2021 in response to higher natural gas and crude oil prices,” the STEO says. “The increase in crude oil prices is expected to raise associated gas production from oil-directed wells in late-2021, especially in the Permian region.”
The STEO estimates that U.S. oil production will average 11.2 million bbl/d in November, but decline to an average of 11.0 MMbbl/d by the second quarter of 2021. With drilling activity expected to pick up in the second half of 2021, the agency says production should reach 11.3 million bbl/d in the fourth quarter of 2021 (Figure 2). “On an annual average basis, EIA expects U.S. crude oil production to fall from 12.2 MMbbl/d in 2019 to 11.4 MMbbl/d in 2020 and 11.1 MMbbl/d in 2021,” the monthly report reads.
FIGURE 2
U.S. Crude Oil Production (Left) and Supply Sources (Right)
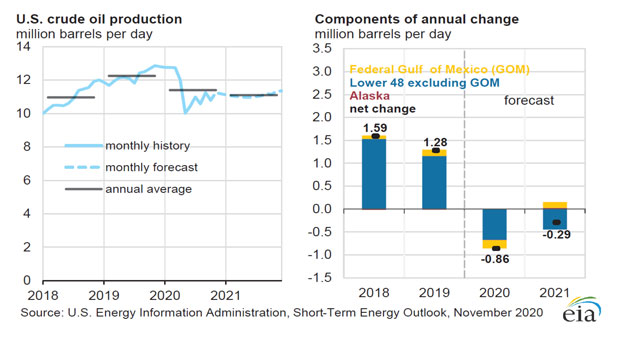
EIA’s weekly data on U.S. oil volumes shows that production was only 10.5 MMbbl/d in both the last week of October and the first week of November. During the same weeks of 2019, oil production average 12.6 MMbbl/d. For the five weeks in October, weekly output data averaged 10.6 MMbbl/d, although production in the third week fell to 9.9 MMbbl/d because of shut-ins resulting from hurricane activity in the Gulf of Mexico.
The monthly Drilling Productivity Report, which was released on Nov. 16, predicts that both oil and gas production in the seven major shale play basins will continue to decline in December after falling by 121,000 barrels and 617 MMcf a day, respectively, in November. For the last month of 2020, EIA shows shale oil production dropping by 140,000 bbl/d to 7.5 MMbbl/d and gas production slipping by 679 MMcf/d to 81.5 MMcf/d.
In the closely watched metric of new-well production per rig, the report shows declines in all major tight oil basins in October, including the Bakken (-383 bbl/d) and the Permian (-65 bbl/d). It was the first monthly decrease in rig-weighted new-well oil production the Permian in more than two years. Appalachia and the Haynesville were then only basins with per-rig productivity gains in new gas well production, with a combined increase of 29 Mcf/d. The biggest declines were in the Eagle Ford (-794 Mcf/d), Bakken (-448 Mcf/d), Anadarko (-312 Mcf/d) and Permian (-110 Mcf/d).
TABLE 1
Weekly U.S. Commercial Crude Oil Inventories and Production (MMbbl)
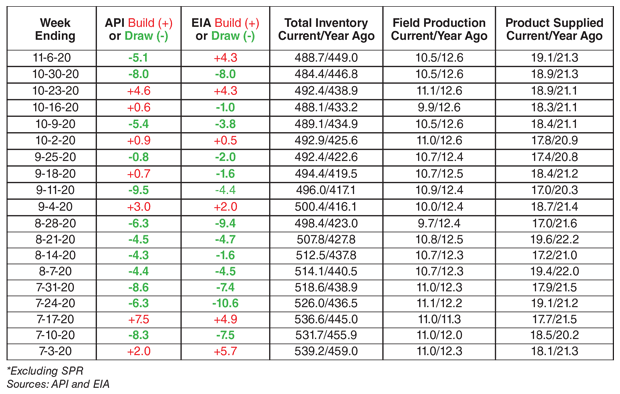
After an extended withdrawal trend that began last summer, U.S. crude oil inventories are now within 40 MMbbl of the year-ago levels (Table 1). While still 6% above the five-year seasonal average, the year-over-year surplus has been significantly diminished since last summer, when inventories were more than 90 MMbbl higher than the previous year. EIA expects global oil inventories to continue falling in the coming months, but says the generally high inventory levels and surplus production capacity will limit upward pressure on prices, with Brent prices increasing from the $40/bbl in October to average $47/bbl in 2021.
An average of 95.3 MMbbl/d of petroleum and liquid fuels were consumed globally in October, which was down 5.9 MMbbl/d from October 2019, but up from both the third-quarter 2020 average of 94.1 MMbbl/d and second-quarter average of 85.3 5.9 MMbbl/d. EIA forecasts that global consumption of petroleum and liquid fuels will increase by 5.9 MMbbl/d in 2021.
For other great articles about exploration, drilling, completions and production, subscribe to The American Oil & Gas Reporter and bookmark www.aogr.com.