


Calculating TOC
Study Analyzes Eagle Ford Characteristics
By Adel A. Alqahtani and Azra N. Tutuncu
GOLDEN, CO.–Total organic carbon (TOC) content is the source of generated hydrocarbons in shale source rocks, making the accurate quantification of TOC an essential element to assessing the development potential of shale source rocks.
TOC is composed mainly of three components:
- Extractable organic matter (EOM) carbon, representing the amount of carbon that can be extracted and produced as oil and/or gas;
- Convertible carbon, representing the remaining potential of organic matter to generate oil or gas; and
- Residual carbon, representing the carbon in a form that has no potential to generate oil or gas.
EOM carbon is generally a very small fraction (~1 percent) of TOC in typical shale samples. When the value of TOC is greater than 1.0-1.5 weight percentage, it is an indicator of a good-quality source rock. However, this piece of information alone is not sufficient. Adequate convertible in situ organic carbon content is still required to generate commercially producible hydrocarbons. The generation index of hydrocarbon is generally obtained by additional screening processes to determine the level of maturity (LOM) and organic matter type. Together, these processes give further assessment of the potentiality of unconventional reservoirs.
TOC significantly influences the response of the well logs collected for rock characterization and well monitoring. Because of the low density of the organic carbon (~1.0-1.4 grams/cubic centimeter), the presence of TOC in the formation has an impact on several rock properties, including bulk density, resistivity, gamma ray, transit time and geomechanical characteristics. To further examine these influences, a Colorado School of Mines research project analyzed the influence of TOC on the acoustic and geomechanical properties of Eagle Ford Shale.
Using high-resolution log-derived reservoir data can help overcome most of the core sampling constraints and provide real-time in situ reservoir characterization. Therefore, several studies have developed new methods to estimate TOC from well logs. The construction of a TOC log allows for rapid identification and classification of potential organic-rich zones, the determination of zones that should be sampled for specialized geochemical analysis, and the determination of the TOC vertical distribution in the formation for input to basin evaluation models.
The developed TOC quantification methods are based on measurements of gamma ray, resistivity, density, sonic, neutron, or nuclear magnetic resonance (NMR) tools. Many well log-derived TOC quantification methods are indirect measurements and require empirical correlations of the log data to the geochemical data obtained from the cores. The accuracy of empirical correlations depends on several factors including the specific characteristics of the organic-rich shale source rock.
Eagle Ford Case Study
In this case study, two TOC quantification methods were evaluated using data from three Eagle Ford Shale wells: BD, CB and LK. The methods are the TOC-density relationship and the delta log R (Δ log R) technique that overlays resistivity and sonic logs. Variations in LOM for the three wells help determine the limitations of each method.
Because changes in organic content can produce significant changes in formation density, the TOC-density method attempts to correlate formation density to TOC. This method was first applied by James Schmoker and colleagues at the U.S. Geological Survey in Appalachian Devonian shales and the Bakken Shale in the Williston Basin. In both studies, the petrophysical system of shale was found to be composed of rock matrix (m), interstitial pores (i), pyrite (p) and organic matter (o). Pyrite mineral is a part of the system because of its high density and its measurable effect on formation density. Therefore, formation density can be defined as shown in Equation 1.
Equation 1: ρ = Øo ρo + Øp ρp + Øi ρi + (1 − Øo − Øp − Øi ) ρm
To reduce the number of unknowns in Equation 1, the pore porosity (Øi) is assumed to be very low and does not significantly alter formation density. A linear relationship between pyrite (Øp) and organic matter (Øo) is determined and used in the equation. Also, the density of organic matter (ρo), matrix density (ρm) and pyrite density (ρp) are set. As a result, the final correlation is expressed as Equation 2, where ρ is the bulk formation density, and A and B are constants specifically calculated for a particular formation or area.
Equation 2: TOC(wt.%) = (A / ρ) − B
Density logs can be the best method to estimate TOC assuming that light and heavy minerals (e.g., pyrite) are not in significant quantities; there are no variations in porosity, fluid phases and lithology over an interval of interest; and good borehole conditions exist since density logs are sensitive to the borehole environment (shale washouts, etc.).
The delta log R approach initially developed by Quinn Passey at ExxonMobil Upstream Research uses a similar principle that involves a combination of porosity and resistivity logs. The method employs the overlaying of a porosity log (in arithmetic scale) and the resistivity log (in logarithmic scale) on an organic-lean shale interval to estimate TOC from the interval at which the two curves separate. A sonic, density or neutron log can be used in this technique, but a sonic log is typically selected since density and neutron logs are adversely affected by the borehole conditions.
The separation between the two curves is empirically derived using Equation 3, where R is the resistivity in ohm-m, Δt is the measured transit time in microseconds per foot, and Rbaseline is the resistivity value corresponding to Δt values when the curves overlie and are baselined in an organic-lean zone.
Equation 3: Δ log R = log10(R/Rbaseline) + ScalingFactor(Δt - Δtbaseline)
The scaling factor is based on the ratio of resistivity logarithmic cycles over the porosity log scale. Determining TOC in the organic-rich zones depends on the Δ log R and the LOM, as shown in Equation 4, where ΔTOC is the TOC regional background level in the shale reservoir. The regional background is not easy to determine, but Passey used 0.8 weight percentage as the minimum TOC in shale reservoirs.
Equation 4: TOC(wt.%) = (Δ log R) × 10(2.297 - 0.1688LOM) + ΔTOC
The Δ log R technique is an empirical method that requires validation by a core-to-log calibration. Log-derived TOC has a relatively low correlation with core measurements in intervals of low TOC. This technique requires a baseline selection that is subjective and requires some level of expertise. Heavy minerals (such as pyrite) can affect resistivity logs and require caution in the TOC evaluation process. In addition, the method may not be applicable at all maturity levels.
FIGURE 1
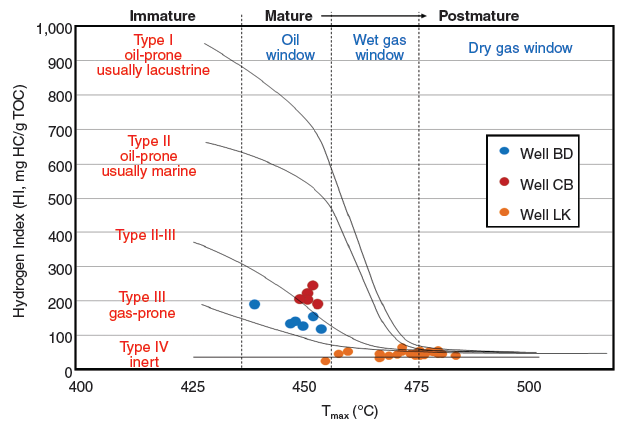
Maturity and Kerogen Types from
Eagle Ford Shale Samples
Study Results
For this study, two of the Eagle Ford wells (BD and CB) are located in the oil window and one (LK) is in the wet gas window. X-ray diffraction analysis shows similar mineralogy in the Eagle Ford formation at all three well locations. A geochemical analysis indicates that TOC varies from 2.5 to 7.7 weight percentage. By plotting the hydrogen index (HI) and the oxygen index (OI) on a Van Krevelen diagram (Figure 1), it is evident that the organic matter is Type II-III, with the potential to produce oil and gas.
FIGURE 2
Level of Maturity for Wells BD, CB and LK using
Core Measurements Superimposed into
LOM Diagram from Δ log R
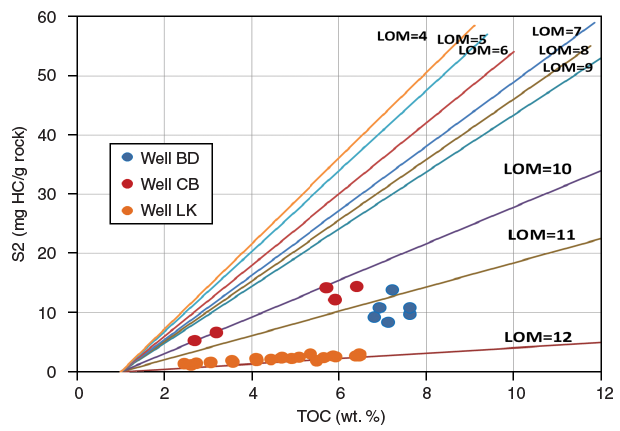
The LOMs of wells BD, CB and LK are 11.3, 10.5 and 12, respectively, as determined using the LOM diagram in Figure 2. These results indicate that the Eagle Ford Shale in wells BD and CB is mature, and overmature in the LK well.
Because of the limited amount of core data available for this study, it was not possible to find a good correlation between the volume fraction of pyrite and organic matter for the Eagle Ford. Therefore, the analysis used the correlation of pyrite and organic matter obtained with the TOC-density method.
Because the three wells were drilled using oil-based fluid and their image logs indicated no borehole condition issues, the computation of TOC from the density log became straight forward. All TOC values obtained from cores were cross-plotted against the TOC calculated from the density log for comparison purposes, as shown in Figure 3A. From the plot, the computed organic content of the three wells appears to be in reasonable agreement with that obtained from core samples.
FIGURE 3A
Cross-Plot of Core-Derived TOC and
Log-Derived TOC using TOC-Density Correlation
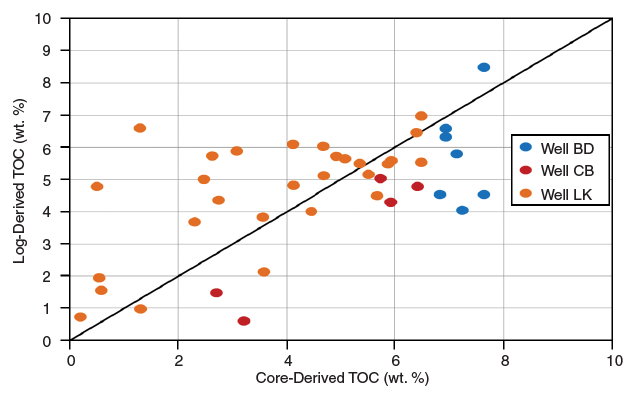
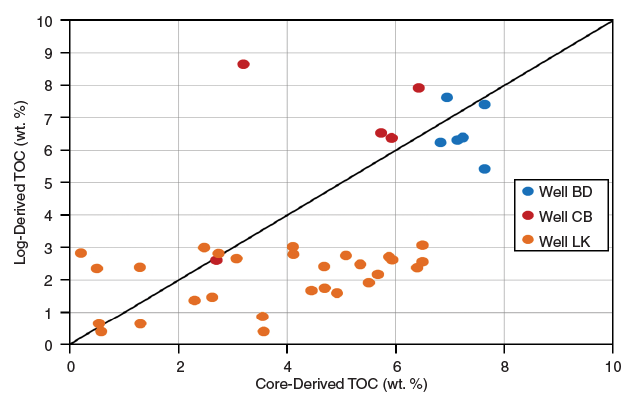
FIGURE 3B
Cross-Plot of Core-Derived TOC and
Log-Derived TOC using Δ log R
In contrast to the TOC-density relationship method, the application of the Δ log R technique is subjected to several variables, including selecting the baseline (organic-lean) interval and accurately determining LOM. To apply this method, compressional transit time and resistivity logs were plotted on the same track, and then the resistivity logarithmic scale was adjusted to get both curves overlain over a significant depth range of organic-lean interval.
The gamma ray curve or knowledge of the local lithology, acquired from elemental capture spectroscopy and/or the density-porosity cross-plot, should help identify the organic-lean interval. The baselines of resistivity and transit-time logs are chosen as the average values for the identified interval. Once the baseline is established, organic-rich intervals are identified by separation and non-parallelism of the two curves.
The calculated Δ log R and LOM were used to quantify TOC. The LOM was obtained from Figure 2. Unlike wells BD and CB, the log-derived TOC of the LK well did not correlate with core-derived TOC (Figure 3B) because of the higher maturity level at the LK location. The Δ log R technique underestimated the log-derived TOC of the overmature shale.
Advantages And Limitations
The availability and quality of log and core data are two major constraints that influence the evaluation of TOC quantification methods. Each of the methods used in the Eagle Ford study has advantages and limitations. From comparing the two TOC quantification methods used in this study, it can be concluded that the Δ log R technique provided better agreement to core-derived TOC for the mature wells BD and CB, but not for the overmature LK well. The TOC-density relationship method worked better for wells CB and LK, but not for Well BD, although the correlation used is for the Bakken shale formation.
The average percentage of absolute difference for each method compared to core-derived TOC was 0.86 for the TOC-density method and 0.73 for the Δ log R method. It is difficult to draw a solid conclusion on which TOC quantification method represents a better fit for the Eagle Ford Shale because of the limited number of core samples used in this study. As more Eagle Ford data become available, it may be possible to obtain a better correlation. However, the results do show that the Δ log R technique is more appropriate for quantifying TOC in more mature areas in the Eagle Ford.
Editor’s Note: The authors acknowledge the sponsors of the Coupled Integrated Multiscale Measurements and Modeling Consortium at the Colorado School of Mines’ Unconventional Natural Gas and Oil Institute for funding and supporting the research discussed in this article.
ADEL A. ALQAHTANI is a petroleum engineering doctoral candidate at the Unconventional Natural Gas and Oil Institute at the Colorado School of Mines. His Ph.D. study is in geomechanics and formation evaluation of organic-rich shale formations. Alqahtani is a petroleum engineer for Saudi Aramco Oil Company. He holds a B.S. in chemical engineering from King Fahd University of Petroleum and Minerals, and an M.S. in petroleum engineering from the University of Calgary.
AZRA N. TUTUNCU is a professor and the Harry D. Campbell chair in petroleum engineering at the Colorado School of Mines. She also is director of the Unconventional Natural Gas and Oil Institute (UNGI). She previously held various research and leadership assignments in the well engineering, rock physics, geomechanics and subsurface research groups at Shell International E&P and Shell Oil Company. Dr. Tutuncu leads several multidisciplinary research consortia focused on reservoir characterization, coupled geomechanics, wave propagation and fluid flow measurements. Dr. Tutuncu is a former president of the American Rock Mechanics Association and is a member of the U.S. Environmental Protection Agency’s Scientific Advisory Board on Hydraulic Fracturing Research. She is a Licensed Professional Engineer and Licensed Geophysicist in Texas.
For other great articles about exploration, drilling, completions and production, subscribe to The American Oil & Gas Reporter and bookmark www.aogr.com.