


Frac Diagnostics
Technology Reveals Valuable Insights About Downhole Fluid Flow
By David Moore and Rachel Stocking
TOMBALL, TX.–Oil and gas producers have long been at the mercy of the rocks they chase. The mysteries of our Earth are infinite, and even though the industry has been at it for a century or more in basins such as the Permian and Appalachian, the geologic puzzles operators are trying to solve today are unprecedented in the history of oil and gas development.
Horizontal drilling and hydraulic fracturing have enabled the pursuit of unconventional resource plays over the past 20 years, but there are still plenty of unanswered questions about tight oil and shale gas reservoirs. With their massive economic impact, unconventional resource plays come with expensive operating costs at a time when the industry is trying to stand up from an extended knockdown. As troops of geologists and engineers descend to make better horizontal wells at less cost, the industry is realizing that it is playing a new game in unconventional basins.
This new game boils down to one word: complexity. The truth is, the industry still does not have a solid handle on the dynamic processes taking place subsurface during hydraulic fracturing and subsequent production in unconventional resource plays. Among the biggest questions being asked is one that revolves around the relationship between an existing parent well and offset child wells, and how infill development impacts the performance of both the parent and the child wells drilled alongside it.
It might sound like a simple problem, but parent-child well interactions have proven more complicated than anyone could have imagined a decade ago. Even after drilling multiple infill wells across a field, operators often remain perplexed by the unclear and unpredictable communication issues between parent and child wells. This uncertainty creates uncertainty in the productivity and recovery capability of individual wells in a field, and the predictability of long-term performance of the entire asset.
The long-term success of every shale play operator is tied to development decisions made along the way. Given the potentially consequential negative impacts of parent and child well pressure communication, the need is more pressing than ever to make the right decisions to mitigate these complex interactions. Understanding the parent-child well dynamics in a specific geologic setting enables producers to better manage development strategies, well spacing, wellbore geometries, fracturing designs, etc.
Unpredictable Variables
Unconventional plays do not fit neatly into traditional economic models. When a process is predictable and repeatable, it gives an organization the confidence to plan and strategize. In resource plays, the number of dynamic variables results in too many unknowns, leading to inefficiencies and unpredictable variables that can be very costly for operators.
The parent-child well development challenges are related to communication between the fracture networks of one or more wells, and resulting changes in the reservoir pressure regimes surrounding the wellbores. After a parent well is fractured and placed on production, it creates a low-pressure zone around the well, and the risk for a fluid divergence to an unwanted area increases. The pathways made by the development of the parent well may affect the production of the child well by diverting the energy needed for proper completion efficiency. It is essential under these interactions to avoid reducing the recovery factor in both parent and child wells.
As a sign of the times, an increasing number of diagnostic tools have been developed to analyze changes in the subsurface during and after stimulation. One such technology uses electromagnetic fluid imaging, which makes a direct measurement of the resistivity change as frac fluid enters the reservoir and moves within the formation. With this monitoring technique, operators do not have to rely on their imaginations to understand dynamic subsurface processes; they can see them in electromagnetic images.
FIGURE 1
Powder River Basin Frac Hit Example
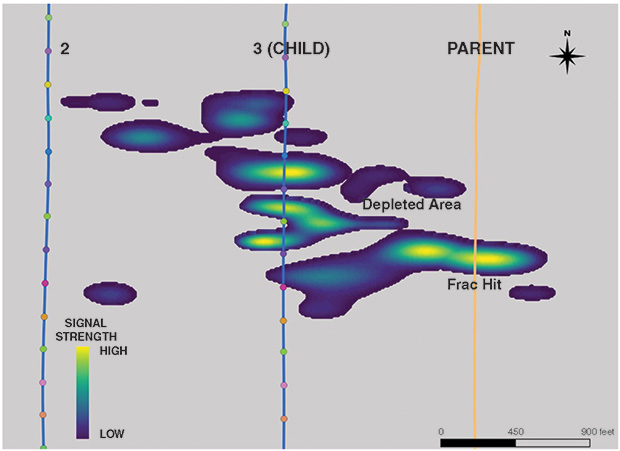
The complexity of parent-child interactions cannot be overemphasized. The relationship is highly unpredictable, and the effects are variable between basins and the unique sets of characteristics within each basin (the presence of faulting, for example). Figure 1 provides an illustration of the dynamics of parent-child well interactions from a development project in the Powder River Basin. The effects of depletion caused by the producing parent well are evident, as is a frac hit between the parent and child wells.
The parent well, which had been producing for seven months prior to completing three infill wells, was shut in during the child well hydraulic fracturing treatments and was equipped with downhole pressure gauges. Each colored dot along the wellbores represent the stage center. The fluid data is scaled by the intensity of the signal, with yellow being the strongest signal and dark blue being a weak signal.
Note how the fluid was drawn toward the parent well from child well No. 3, as was anticipated, with the intensity of the signal (or the amount of change in resistivity) sitting in between the two wells. This behavior was seen continually along infill well No. 3 and frac hits were observed between this child well and the parent well. The client acquired formation microimaging (FMI) log data prior to the infill completion program, which showed a mix of natural pre-existing fractures, and what appeared to be man-made fractures caused by the completion of the parent well. The data is in the process of being analyzed, but there is agreement between the FMI log data and the electromagnetic fluid tracking images. Tracer data also was acquired during this project and is currently being analyzed.
With an understanding of the dynamic process taking place between the infill well fracs and the geology altered by the parent well, the client is evaluating a number of solutions, some of which were tested during this project (i.e., frac order sequencing between infill wells). For future investigation, the operator could view the electromagnetic data in real time to test the effects of diverter to avoid areas of depletion, experiment with completion job sizes, etc. The sky is the limit.
Challenging Conditions
FIGURE 2
Anadarko Basin Parent-Child Well Interactions in Presence of Fault
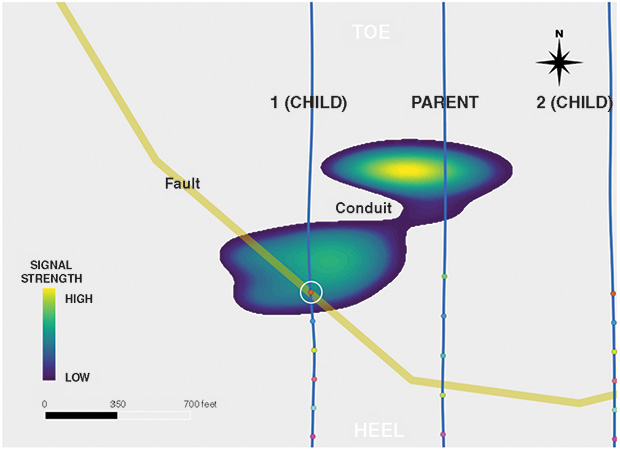
What about situations with challenging geologic conditions such as faulting, or more complicated fracturing operations such as zippering? Figure 2 shows a parent well in the Anadarko Basin that is offset on either side by child wells 1 and 2. There is a fault at reservoir depth that played a role in the placement of fluid in the reservoir. The yellow line denotes the fault at reservoir depth. In the case of the stage on Well No. 1 (thin white circle), which is located just south of the fault, the fluid appeared to have been drawn into the area of the fault near the stage being treated, but also noticeable is a pathway created from the fluid surrounding the stage center located along the fault that travels north and connects with the parent well.
It appears that the operator may have tapped into a natural fracture system and/or an area of depletion, which caused a frac hit with the parent well. The fluid data is again scaled by the intensity of the signal, with yellow being strong and dark blue being weak.
In the Eagle Ford, electromagnetic fluid imaging was applied to study the effects of pressuring up a parent well using slow and continual water injection (as opposed to shutting in the parent well in the Powder River Basin example), combined with frac zipper sequencing of the infill wells with the intent to push the fluid away from the treatment well. From the electromagnetic fluid data, the client surmised that the frac order appeared to have more influence on frac fluid movement than the parent well pressure. Evidence of that can be seen in stages 22, 26 and 27 of Well A in Figure 3, where the fluid reverted toward the parent well.
FIGURE 3
Eagle Ford Example with Zipper Fractured Infill Wells
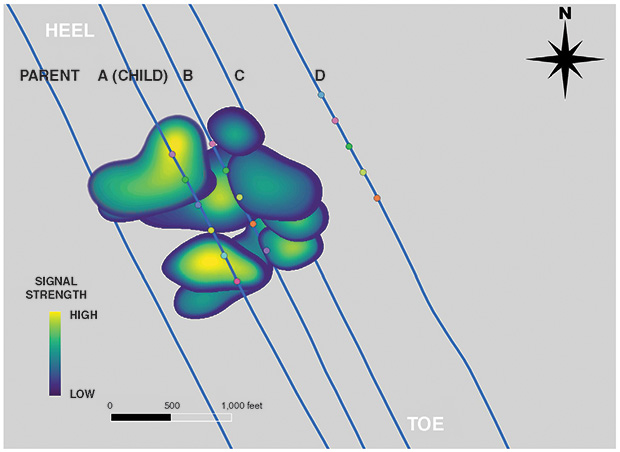
The infill wells were zippered in order (A, B, C and then D), and for wells B, C and D, the fluid trended away from the parent well (west), as desired. It should be noted that Well B was drilled in a shallower horizon than wells A, C and D.
These examples, and many more like them, show that there are no hard and fast rules when it comes to understanding the dynamic relationship between parent and child wells, at least yet. The more the industry studies this relationship and all the involved interrelated variables, the better handle operators will have on the issue.
The variables that are easy to miss are the real wild cards in the completions process. For example, how often does a plug not achieve complete stage isolation? How coupled is the production casing to the annulus? On the surface, these issues sound troubling but not threatening. However, the risk increases with every stage. If a plug is not set correctly, an additional amount of fluid may be added to the same rock on top of the designated fluid and proppant volume, causing an unexpected amount of material in each stage. Where else does that fluid go except farther out or up into the rock?
Suddenly the recipe is no longer straightforward, and fluid may end up where the operator had no intention of pumping it. Not only has the fluid missed the opportunity to treat the rich rock formation, but now that fluid is likely interacting with a neighboring well in a way that the frac model had not calculated, causing a potential frac hit.
With multiple frac fleets pumping neighboring wells in parallel, the need for predictability has increased. The strategy often advocated is that operators use the “pressure-up effect” to better stimulate the rock: inside out, outside in, top to bottom, and bottom to top. Mixed in with this is the approach of sequencing how long pressure curtains are left intact and when wells are turned on to production. These interactions are convoluted, to say the least, but emerging technologies are helping to clarify this complexity.
Diagnostic tools along the well that show perforation cluster performance demonstrate the perf during treatment and flow back. Since observations are at a distance, electromagnetic methods show an overall view of the process of each stage. Some stages stay trapped near the start of the well while others become overpressured or reach a weak zone, which results in interference with neighboring wells. Once again, the previous stages, neighboring wells, and local geologic conditions heavily influence stage performance.
Pivotal Point
The industry finds itself at a pivotal point where the approach to unconventional development must evolve. With the current advancements in technology and the computing power at hand, it is time for the next jump forward.
The first step is improving subsurface models used to predict fracturing performance. Any system in place is based on assumptions. It is when those assumptions fall flat that the outcomes surprise and regularly disappoint. Unconventional reservoir development is no different. By observing how completions techniques and strategies interact with the subsurface, models can be revised to more precisely predict outcomes and improve development strategies. This challenge will be difficult, and the insights gained may sometimes conflict with deep-seated beliefs, but profits will follow.
The second step can be summarized as “watch, react and learn (and do it all in real time).” So many workflows and processes are fraught with fear of making a mistake. Safety and environmental regulations allow for zero errors and require strict methods of practice. On the production side, operators can take advantage of the trial and error that often allows new ideas and approaches to be adopted. Electromagnetic diagnostic tools allow operators to watch fractures and flowback in real time and diagnose hazards as they develop.
This imaging capability allows engineers to make fast decisions about well spacing, test the efficacy of diverters to avoid areas of depletion, and determine where plug failures contributed to a stage not stimulating the intended pay zone. The real-time observation empowers operators to make quick decisions with impactful results. The more information operators have about a given problem, the easier it is to tackle it from different perspectives.
As the industry identifies new hazards and creates newer technologies, teams will develop procedures to help operators get back to their planned stimulation. Optimistically, stimulation engineering is expected to evolve to solve these issues more efficiently and effectively to unravel the variability.
DAVID MOORE is president and chief executive officer of Deep Imaging Technologies and president and CEO of GMI Group. He served for 16 years at GE in a variety of management positions, including general manager of aftermarket solution for flow and process technologies, product management executive, and regional commercial manager for steam turbines and generators. Moore began his career as a chief aircraft battle damage repair engineer for the U.S. Air Force. He holds a bachelor’s in mechanical engineering from Florida State University.
RACHEL STOCKING is business development manager at Deep Imaging Technologies. She previously served as a sales representative at ESG Solutions, account manager at Spectraseis, business development manager at NodalSeismic, manager of public/community relations and government affairs at Signal Hill Petroleum, account executive for ETA advertising, and account manager at The Kreisler Group. Stocking holds a B.A. in journalism from California State University-Long Beach.
For other great articles about exploration, drilling, completions and production, subscribe to The American Oil & Gas Reporter and bookmark www.aogr.com.