


Oil And Gas Inventories
U.S. Markets See Big Oil Draw, First Seasonal Gas Draw
U.S. crude oil inventories fell by 8.0 million barrels during the last week of October, which was the largest weekly draw since August, according to the U.S. Energy Information Administration. Between the start of July and the end of October, EIA reports a net reduction of 55 million barrels in commercial storage volumes.
But most encouraging to oil markets, the first week following U.S. elections began with encouraging news on a Coronavirus vaccine, rallying oil prices on the New York Mercantile Exchange by more than 10%–one of the largest single-day gains in 2020. On Nov. 9, Pfizer and BioNTech said the developed vaccine had proved more than 90% effective at preventing COVID-19, and could soon begin to be administered on an emergency usage basis, assuming final approval by the U.S. Food & Drug Administration.
Prices also responded favorably to Saudi Arabian Energy Minister Prince Abdulaziz bin Salman’s assurances over the weekend that OPEC would continue to aggressively manage supply, including the possibility of extending and perhaps even deepening current production quotas.
For the week ending Oct. 30, reports from both EIA and the American Petroleum Institute were in rare agreement, with both showing a decline of 8.0 MMbbl. In its Weekly Petroleum Status Report released on Nov. 4, EIA reported decreases in crude oil, distillate and Propane/propylene stocks, but an increase in gasoline inventories. The consensus prediction of market analysts had been a small crude inventory draw of 600,000 for the week.
Going back to the first week of July, all but five of 18 weeks have registered crude inventory withdrawals (Table 1) according EIA’s tally. API shows 11 of the 18 weeks with net inventory draws. Since late June, commercial crude inventories have been drawn down from 539.2 MMbbl to 484.4 MMbbl based on EIA’s weekly numbers. Crude oil stocks are now only 37.6 MMbbl higher than year-ago inventories, compared to mid-summer, when they were more than 90 MMbbl above the same time in 2019.
TABLE 1
Weekly U.S. Commercial Crude Oil Inventories and Production (MMbbl)
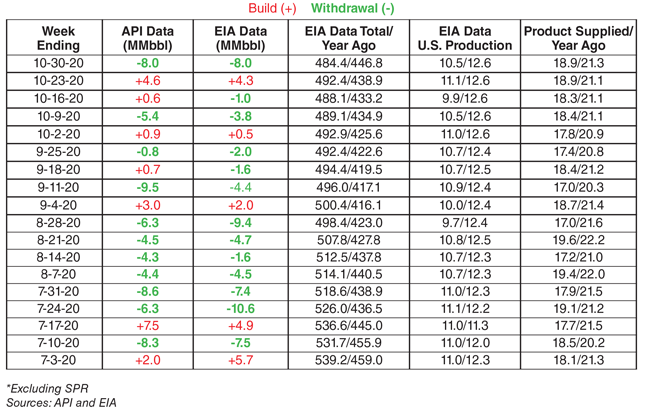
The large draw for the last week of October was in stark contrast to 2018 and 2019, when crude inventories climbed by 5.8 MMbbl and 8 MMbbl, respectively, during the same weeks. Importantly, the bullish withdrawal cycle also has occurred with significantly lower refinery runs than in either 2018 or 2019. Since mid-July, EIA points out that refinery inputs have averaged between 13% and 17% lower than the five-year average.
Yet, from Labor Day through the end of the second week of October, a seasonal period during which stocks have historically tended to build, EIA reports that inventories declined by 13.2 MMbbl. From Labor Day weekend through the end of October in 2018, inventories grew by 30.3 MMbbl. The same period in 2019 saw a 23.8 MMbbl build.
In the latest report, U.S. refinery inputs averaged 13.6 MMbbl/d, which was up 163,000 bbl/d from the previous week’s average. Refineries operated at 75.3% of their operable capacity, which was substantially below both 2018 and 2019. Refinery inputs averaged 16.4 MMbbl/d and 15.8 MMbbl/d in the first week the fourth week of October in 2018 and 23019, respectively, operating at 90.0% and 86.0% of their operable capacity.
Gasoline production decreased last week to 9.1 MMbbl/d and distillate fuel production increased to 4.3 MMbbl/d. For historical reference, gasoline production averaged 10.0 MMbbl/d and 9.7 MMbbl/d, respectively, in the first weeks of October of 2018 and 2019, and distillate runs were 4.9 MMbbl/d and 5.0 MMbbl/d.
Imports And Exports
EIA says crude oil imports averaged 7.5 MMbbl/d, up by 195,000 bbl/d from the previous week. Over the past four weeks, crude oil imports averaged about 7.5 MMbbl/d, or 1.2% less than the same four-week period in 2019. Meanwhile, crude oil exports were 2.3 MMbbl/d, which was down 1.2 MMbbl/d from the week prior and down 106,000 bbl/d from the same week in 2019.
U.S. commercial crude oil inventories, excluding the Strategic Petroleum Reserve, were at 484.4 million barrels, which was 7% above the five-year seasonal average. A year ago, there were 446.8 million barrels in storage. The year-over-year difference of 37.6 MMbbl of inventory in equivalent to less than two days’ worth of domestic demand. Last summer, the year-over-year surplus had ballooned to as high as nearly five days of supply.
Total commercial petroleum inventories decreased by 14.7 MMbbl in the week ending Oct. 30. Total motor gasoline inventories increased by 1.5 MMbbl last week and are about 4% above the five year seasonal average. Distillate inventories decreased by 1.6 MMbbl but are still 18% above the five-year average. Propane/propylene inventories decreased by 2.6 MMbbl to 8% above the five-year seasonal trend.
Total products supplied over the last four-week period averaged 18.9 MMbbl/d, down by 10.9% from the same period last year. Over the past four weeks, gasoline product supplied averaged 8.4 MMbbl/d, down 10.9% year over year. Distillate fuel product supplied averaged 3.9 MMbbl/d over the past four weeks, down by 7.3% from a year earlier. Jet fuel product supplied was down 44.6%.
EIA projects in its October Short-Term Energy Outlook that U.S. crude oil production would fall from an annualized average of 12.2 MMbbl/d in 2019 to 11.0 MMbbl/d in the second quarter of 2021. “EIA expects drilling activity to rise later in 2021, contributing to U.S. crude oil production returning to 11.2 MMbbl/d in the fourth quarter of 2021,” the report reads.
In its latest Drilling Productivity Report, EIA forecasts that crude oil production from the “big seven” onshore shale basins will fall 121,000 bbl/d in November, with decreases in all basins and led by the Eagle Ford, Niobrara and Bakken/Three Forks.
Natural Gas Storage
Looking at the natural gas market, EIA reported the first storage withdrawal of the 2020-21 winter heating season during the week ending Oct. 30. The 36 billion cubic feet pulled from storage left total stocks at 3.92 trillion cubic feet. That was 203 Bcf (5.4%) higher than the same time in 2019, and 202 Bcf (5.4%) above the five-year historical average of 3.72 Tcf (Table 2).
TABLE 2
Weekly U.S. Natural Gas Storage and Production (Bcf)
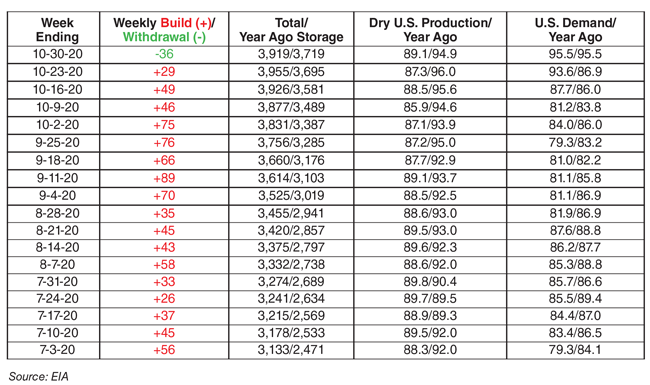
For the week of Oct. 29-Nov. 4, EIA says total U.S. gas demand climbed from 93.7 Bcf/d to 95.5 Bcf/d, equally total demand during the same week in 2019. The biggest gains were in the residential and commercial consumption sector, which increased by 4.2 Bcf/d week over week amid colder fall temperatures. Exports to Mexico were down slightly to 5.4 Bcf/d, and natural gas deliveries to U.S. liquefied natural gas export facilities rose by 1.1 Bcf/d from the prior week to 10.1 Bcf/d.
A total of 22 LNG vessels (nine from Sabine Pass, four each from Freeport and Corpus Christi, three from Cameron, and two from Cove Point) with a combined LNG-carrying capacity of 82 Bcf departed the United States between Oct. 29 and Nov. 4, EIA reports. Compared to the previous week of Oct.22-28, LNG shipments increased by six vessels and 24 Bcf.
EIA estimated that total U.S. dry gas production averaged 94.2 Bcf/d, up from 92.5 Bcf/d from the previous week and down 5.0 Bcf/d from 99.2 Bcf/d on a year-over-year basis. EIA’s models show those declines will continue in November in all major shale basins. In its October Drilling Productivity Report, the agency projects gas production will decline by 617 million cubic feet a day, led by the Anadarko, Appalachian and Eagle Ford regions.
For other great articles about exploration, drilling, completions and production, subscribe to The American Oil & Gas Reporter and bookmark www.aogr.com.