


Crude Inventory Update
U.S. Oil Inventories Continue Weekly Decline Trend
U.S. crude oil inventories added to the ongoing trendline of withdrawals in the fourth week of September, with data from the U.S. Energy Information Administration showing a 2.0 million barrel draw that week, marking nine of the previous 10 weeks with a reduction in commercial storage volumes.
In its Weekly Petroleum Status Report released on Sept. 30, EIA showed a decline of 2.0 million barrels for the week ending Sept. 25, along with a 700,000 barrel build in gasoline and a 3.2 MMbbl/d draw in distillate stocks. A day earlier, the American Petroleum Institute released its weekly survey, showing a net withdraw of 831,000 but with a 1.623 MMbbl build in gasoline inventories. The consensus prediction of market analysts had been a crude inventory build of 1.4 MMbbl for the week.
Going back to the first week of July, all but three of 13 weeks have registered crude inventory withdrawals (Table 1) according EIA’s tally. API shows four of the 13 weeks with net inventory draws. Since the end of June, commercial crude inventories have been drawn down more than 40 MMbbl based on both EIA and API’s weekly numbers.
TABLE 1
Weekly U.S. Commercial Crude Oil Inventories and Production (MMbbl)
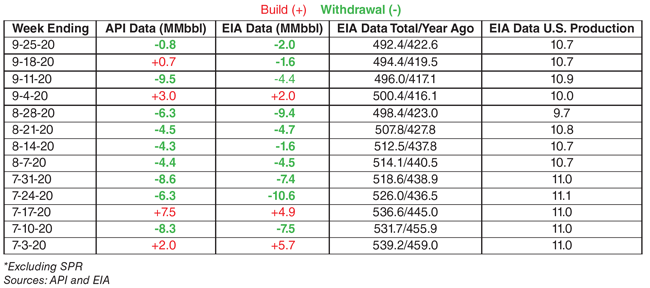
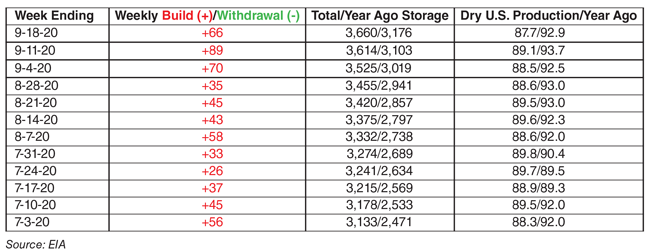
TABLE 2
Weekly U.S. Natural Gas Storage and Production (Bcf)
Since the first week of August, EIA reports that stocks have declined by a net 26.2 MMbbl, with only week showing an inventory build. Over that same period in 2018, stocks declined by only 5.0 MMbbl with four weeks of inventory additions. In 2019, inventories decreased 15.6 MMbbl from the start of August to the third week of September, and also had four weekly builds.
U.S. refinery inputs averaged 13.7 MMbbl/d, up 300,000 bbl/d from the previous week’s average. Refineries operated at 75.8% of their operable capacity, down one percentage point from the week prior. That was substantially below both 2018 and 2019. Refinery inputs in both years averaged 16.5 MMbbl/d during the fourth week of September, operating at 90% of their operable capacity. Both gasoline and distillate fuel production decreased last week, averaging 8.9 MMbbl/d and 4.4 MMbbl/d, respectively. For historical reference, gasoline production averaged 9.8 MMbbl/d and 10.2 MMbbl/d, respectively, in the fourth weeks of September of 2018 and 2019, and distillate runs were 5.0 MMbbl/d in both years.
EIA says crude oil imports were 5.1 MMbbl/d, down 45,000 bbl/d from the previous week. Over the past four weeks, crude oil imports averaged about 5.2 MMbbl/d, or 21.6% less than the same four-week period in 2019. Meanwhile, crude oil exports were 3.5 MMbbl/d, up 500,000 bbl/d from the week prior and from the same week in 2019.
U.S. commercial crude oil inventories, excluding the Strategic Petroleum Reserve, were at 492.4 million barrels, which was 13% above the five-year seasonal average (Figure 1). However, it marked the third consecutive week that total inventories were below 500 MMbbl, which had not happened since COVID-19 lockdown measures began to be implemented in late March/early April. A year ago, there were 422.6 million barrels in storage. The year-over-year difference of 69.8 MMbbl of inventory equates to three and half days’ worth of domestic demand.
FIGURE 1
U.S. Commercial Crude Oil Inventories
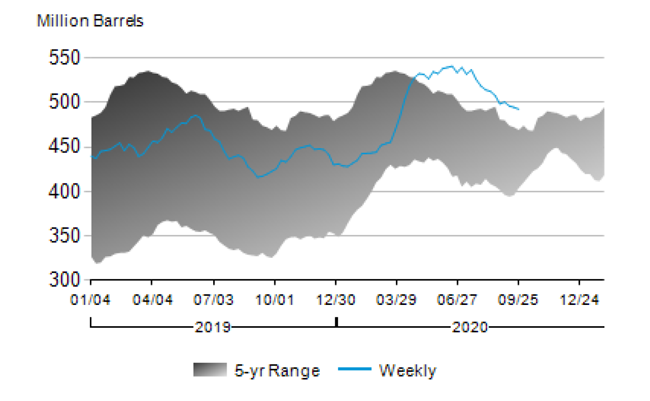
Source: EIA
Total motor gasoline inventories increased 700,000 barrels in the week ending Sept. 25 and are only 1% above the five-year seasonal trend. Distillate inventories decreased 3.2 MMbbl but are still 21% above the five-year average. Propane/propylene inventories increased 4.1 MMbbl to 15% above the five-year average. Over the past four weeks, gasoline product supplied averaged 8.5 MMbbl/d, down 8.9% year over year. Distillate fuel product supplied averaged 3.5 MMbbl/d over the past four weeks, down 8.9% from a year earlier. Jet fuel product supplied was down 46.1%.
Right Direction
Despite multiple hurricanes in the Gulf Coast region, economic uncertainties over the pandemic, and lingering demand impacts, the arrows on inventory numbers continue to trend in the right direction. On the supply side, U.S. oil production continues to remain far below its year-ago level of 12.5 MMbbl/d. For the fourth week of September, oil production averaged 10.7 MMbbl/d, remaining unchanged from the previous week. It was the eighth consecutive week under 11 MMbbl/d, a threshold that was last achieved during the final week of July, and 2.4 MMbbl/d below the March peak of 13.1 MMbbl/d.
EIA projects in its September Short-Term Energy Outlook that U.S. crude oil production would fall from an annualized average of 12.2 MMbbl/d in 2019 to 11.4 MMbbl/d in 2020 and 11.1 MMbbl/d in 2021. “U.S. crude oil production will remain just under 11.0 MMbbl/d during the first half of 2021 because EIA expects that new drilling activity will not generate enough production to offset declines from existing wells,” the report reads. “EIA expects drilling activity to rise later in 2021, contributing to U.S. crude oil production reaching an average of 11.3 MMbbl/d in the fourth quarter of 2021.”
In its latest Drilling Productivity Report, EIA forecasts that crude oil production from the “big seven” onshore shale basins will fall 19,000 bbl/d in September, with increases of 7,000 bbl/d in both the Bakken and Permian partially offsetting declines in the other basins. Even though EIA expects Permian production to jump 23,000 bbl/d in October, the overall decline in shale plays will accelerate to 68,000 bbl/d next month as output retracts in the other six basins–including double-digit declines ranging between 19,000 and 28,000 bbl/d in the Bakken, Anadarko, Niobrara and Eagle Ford.
Natural Gas Storage
Looking at the natural gas market, EIA reported a storage build of 66 Bcf for the week ending Sept. 18, increasing total stocks to 3.68 trillion cubic feet. That was 504 Bcf (15.9%) higher than the same time in 2019, and 407 Bcf (12%) above the five-year historical average of 3.27 Tcf (Figure 2).
FIGURE 2
U.S. Underground Natural Gas Storage Inventories
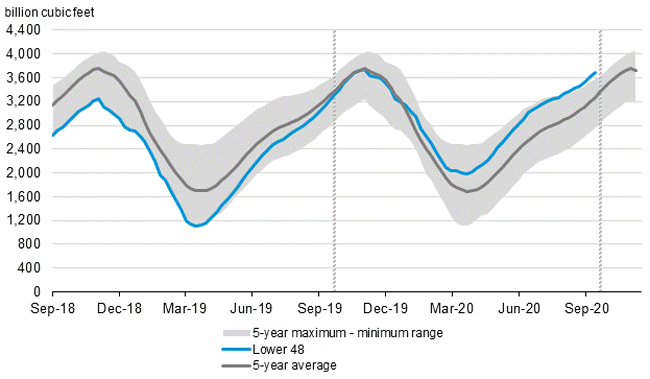
Source: EIA
For the fourth week of September, EIA says residential and commercial natural gas consumption increased 2.3 Bcf/d (27.9%) week over week amid cooler temperatures on the East Coast. Power generation declined by 6.7%. Industrial sector consumption increased 2.3%. Natural gas exports to Mexico increased 3.9%. Natural gas deliveries to U.S. liquefied natural gas export facilities averaged 6.0 Bcf/d, or 1.0 Bcf/d lower than last week. LNG pipeline receipts fell to nearly 4.0 Bcf/d on Tuesday as Tropical Storm Beta moved through the Gulf of Mexico, disrupting LNG tanker movements. Dominion Energy also announced on Sept. 21that its Cove Point LNG facility had been temporarily shut down for annual maintenance.
U.S. LNG exports decreased week over week. Ten LNG vessels (four from Sabine Pass, three from Corpus Christi, two from Cove Point, and one from Freeport) with a combined LNG-carrying capacity of 37 Bcf departed the United States between Sept. 17 and Sept. 23, according to EIA reports.
The Cameron LNG terminal has remained offline through September awaiting the repairs of the power grid servicing the facility. According to multiple reports, Sempra Energy began restart operations on one of Cameron LNG’s three production trains on Sept. 21 following the partial restoration of electricity service at the site. The phased restart is expected to bring the terminal up to full liquefaction and export capacity by late October.
The restart of all three trains at Cameron LNG would recover 1.5 Bcf/d of temporarily lost feed gas demand. Analysts say the pending resumption of operations at Cameron and restart of Sabine Pass earlier in September, along with new liquefaction trains brought online in recent months, is expected to drive total LNG feed gas demand to as high as 10 Bcf/d by November, coinciding with the start of the winter heating season. EIA says U.S. LNG exports averaged 7.9 Bcf/d in the first three months of 2020, before declining to 3.1 Bcf/d in July as the global market recalibrated after the COVID shutdown.
During the final full week of September, EIA estimated that total U.S. dry gas production averaged 87.7 Bcf/d, down 700 MMcf/d (0.9%) from the previous week and down 5.5 Bcf/d (6%) from 93.2 Bcf/d on a year-over-year basis. Looking at onshore shale plays, EIA projects that gas production will decline in all regions in September, except for the Bakken and Permian, where it forecasts increases of 15 MMcf/d and 25 MMcf/d. Overall, EIA sees gas production from shales falling by a net 421 MMcf/d in September.
EIA’s models show those declines continuing in October in all regions, with the exception again of the Permian, where a 110-MMcf/d increase is predicted. Excluding the Permian, gas production is forecast to fall by 538 MMcf/d, and a net 438 MMcf/d with Permian factored in. The largest declines are expected in the Anadarko, Appalachian and Eagle Ford plays.
For other great articles about exploration, drilling, completions and production, subscribe to The American Oil & Gas Reporter and bookmark www.aogr.com.