


Energy Outlook
U.S. Production Growth Dominates EIA Forecast
WASHINGTON–Although the United States has been a net energy importer since 1953, the nation will become a net exporter by 2022, according to the U.S. Energy Information Administration’s Annual Energy Outlook (AEO), released Feb. 8.
“This transition occurs even earlier in some sensitivity cases that incorporate assumptions supporting larger growth in oil and natural gas production or that have higher oil prices,” the agency states, noting that the report presents projections for U.S. energy markets through 2050 based on a most-likely reference case and six sensitivity cases.
One of the main takeaways from the 2018 AEO is that U.S. liquids and natural gas production is poised to grow for decades, leading to increasing oil and natural gas export volumes. In the reference case, production from shale gas resources is projected to increase through 2050, while U.S. liquids production (mostly crude oil) begins to decline only toward the end of the projection period as less productive areas outside the fairways of tight oil plays begin to be developed.
“Continued technological advancements and improvements in industry practices are expected to lower costs and increase the volume of oil and natural gas recovered per well,” the report reads. “These advancements have a significant cumulative effect in plays that extend over wide areas and that have large undeveloped resources.”
In its Short-Term Energy Outlook (STEO) issued Feb. 6, EIA reports that U.S. crude oil production averaged 10.2 million barrels a day in January, up 100,000 bbl/d from December. The agency says total U.S. crude oil production averaged 9.3 million bbl/d in 2017, and forecasts an average of 10.6 million bbl/d in 2018, which would mark the highest annual oil production level in the nation’s history. And output growth will continue in 2019, when EIA predicts U.S. oil production will average 11.2 million bbl/d–1.6 million bbl/d above the historic peak of 9.6 million bbl/d set in 1970.
In the AEO, however, EIA says it sees post-2019 domestic production leveling off and then remaining relatively flat over the longer term. “Lower-48 onshore tight oil development continues to be the main driver of total U.S. crude oil production, accounting for about 65 percent of cumulative domestic production in the reference case over the projection period to 2050,” the AEO states. “Reference-case U.S. crude oil production levels off between 11.0 million and 12.0 million barrels a day as tight oil development moves into less productive areas and as well productivity declines.”
EIA says it expects onshore crude oil production growth to occur mainly in stacked tight oil plays in the Permian Basin, which it describes as “one of the lower-cost areas to develop.” The Dakotas/Rocky Mountain region is forecast to be the second-largest growth area, driven by production increases from the Bakken and Niobrara. EIA says onshore Gulf Coast production will increase through 2025 before flattening as drilling in the Eagle Ford becomes less productive. Gulf of Mexico production is on track to rise through 2021, but then decline through 2035 before stabilizing as new deepwater discoveries start offsetting declines in legacy fields.
Natural Gas And NGLs
With continued development of tight oil and shale gas resources, domestic natural gas production in the AEO reference case is pegged to grow at an annual rate of 6 percent through 2020, exceeding the 4 percent average annual growth rate achieved from 2005 to 2015. The agency estimates that U.S. dry natural gas production averaged 73.6 billion cubic feet a day in 2017, and says it should reach 80.3 Bcf/d in 2018–the highest annual average growth rate on record. EIA expects natural gas output to increase in 2019 also, but at a lower rate of 2.6 Bcf/d.
FIGURE 1
Forecast U.S. Crude Oil and NGL Production
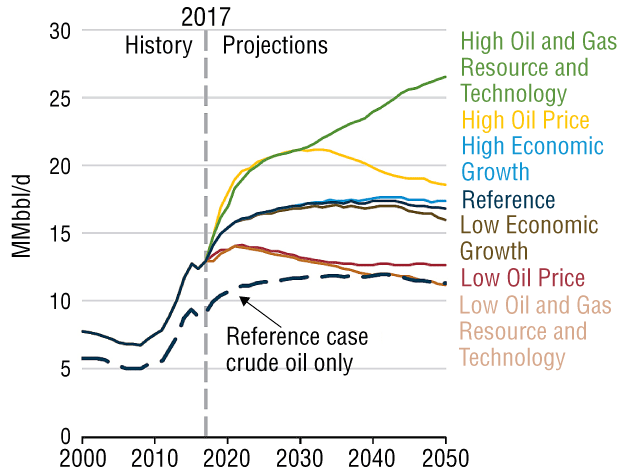
Source: U.S. Energy Information Administration
“Near-term production growth across all cases is supported by growing demand from large natural gas-intensive, capital-intensive chemical projects and from the development of liquefaction export terminals,” the report states. “However, after 2020, it slows to less than 1 percent a year for the remainder of the projection, with shale gas plays and associated gas from tight oil plays accounting for more than 75 percent of total U.S. gas output by 2050.”
Continued development of the Marcellus and Utica plays will lead the expansion of shale gas production, and represent the main source of total U.S. dry gas output, EIA details. Eagle Ford and Haynesville production will be secondary sources of dry gas growth, but the agency says it expects production in those plays to level off beginning late in the 2020s. Associated gas production from Permian tight oil plays is forecast to grow strongly throughout the entire projection period.
In the reference case, pipeline exports to Mexico would increase through 2030 as the result of expanding pipeline infrastructure allowing increased Mexican gas-fired power generation. After the five U.S. LNG export facilities under construction are completed by 2021, the report projects U.S. LNG export capacity will hit 7 Bcf/d.
Growth also is in the cards for natural gas liquids, with the AEO predicting natural gas plant liquids production to hit 5.0 million bbl/d in 2023, which would represent a 35 percent jump over the 2017 level. “Most NGL production growth in the reference case occurs before 2025, when increased demand spurs higher ethane recovery and producers focus on NGL-rich plays, where NGL-to-gas ratios are highest,” the report suggests. “After 2025, production migrates to areas where this ratio is lower.”
The main drivers of increased NGL output over the next decade will be the Marcellus/Utica and the Permian Basin regions, according to the AEO analysis. By 2050, these two regions are expected to account for more than 60 percent of total U.S. NGL production.
Higher Oil Production
In its February STEO, EIA raised its U.S. crude oil production forecasts by 300,000 bbl/d for both 2018 (10.6 million bbl/d) and 2019 (11.2 million bbl/d), compared with its January monthly report. “The higher production reflects both the incorporation of recently reported survey data that was higher than expected in the previous STEO and a higher crude oil price forecast,” the agency explains.
FIGURE 2
Forecast U.S. Natural Gas Production
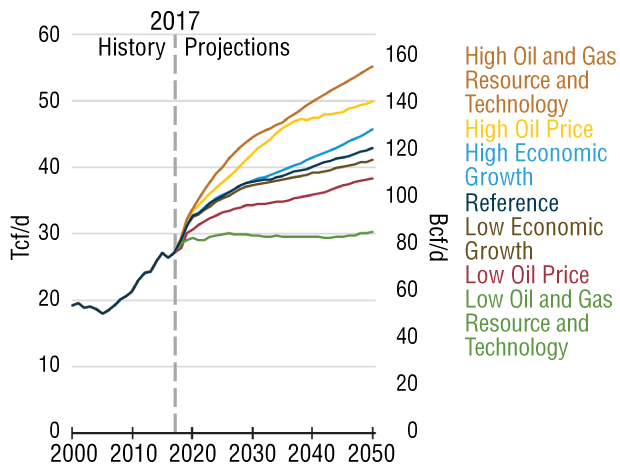
Source: U.S. Energy Information Administration
EIA’s short-term forecast calls for the reference Brent spot prices to average $62/bbl in both 2018 and 2019 (compared with an average of $54/bbl in 2017), with West Texas Intermediate prices averaging $4/bbl lower than Brent. EIA estimates that global petroleum and other liquid fuel inventories declined by 500,000 bbl/d in 2017. In its latest forecast, global inventories would grow by 200,000 bbl/d in both 2018 and 2019 with increasing non-OPEC output.
Based on its expectations of record natural gas production growth, EIA says it sees Henry Hub spot prices averaging $3.20/MMBtu in 2018 and $3.08/MMBtu in 2019. The share of total U.S. utility-scale electricity generation from natural gas-fired power plants will rise from 32 percent in 2017 to 34 percent by 2019, according to the STEO.
EIA data show that U.S. crude oil exports averaged 1.4 million bbl/d for the four weeks ending Jan. 26, which was double the level of January 2017. Similar to the draw in U.S. inventories, Organization for Economic Cooperation and Development (OECD) oil inventories also declined. EIA estimates that total OECD petroleum inventories were 2.87 billion barrels in January, down 183.0 million barrels from January 2017–the largest year-over-year decline since March 2003. However, EIA points out that accelerating growth in non-OPEC supply is expected to contribute to global total petroleum and other liquids inventories rising in 2018.
For other great articles about exploration, drilling, completions and production, subscribe to The American Oil & Gas Reporter and bookmark www.aogr.com.