


U.S. Spending Rebound Sets Stage For Higher Costs
As in virtually every other facet of the economy, supply chain costs are set to increase for U.S. oil and gas projects, with the engineering, procurement, construction and installation (EPCI) segment being the first to record a double-digit percentage hike in costs, a Rystad Energy report forecasts.
Figure 1 shows forest U.S. oil and gas capital expenditures by segment. Overall, Rystad projects that U.S. spending will rebound from $91 billion in 2020 to an expected $99 billion this year, and then to the $112 billion range in 2022. Although strong oil prices indicates a more favorable economic outlook, the growth of EPCI costs is a cause for concern for oil and gas operators in the near term, according to Rystad.
FIGURE 1
Forecast U.S. Oil and Gas CAPEX ($/million)
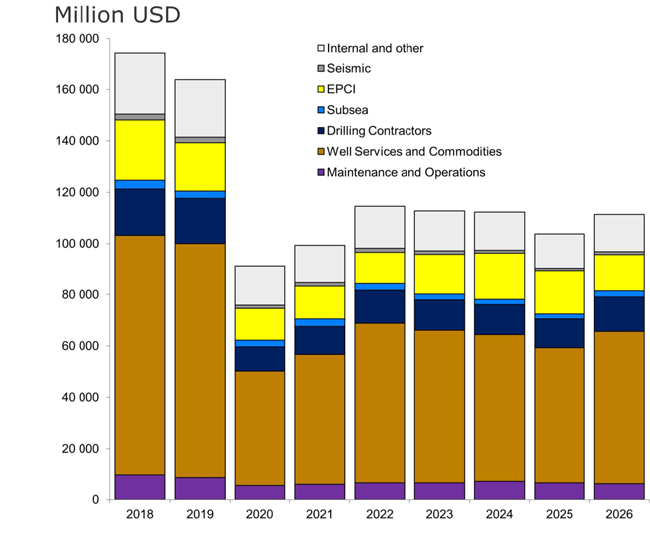
“This year’s EPCI capital expenditures are estimated to total $12.6 billion, which means the segment is poised for a significant spending increase in 2023, irrespective of the cost rise,” the report states. “The figure will climb even further in 2024 to $18 billion.”
As a result, U.S. capital expenditure on EPCI in 2023 is expected to be $15.5 billion, or $1.4 billion higher than it would be under the current cost status quo. Higher expected construction wages account for $1 billion of that extra cost, with the remaining $400 million coming mostly from the rising cost of bulk materials in addition to engineering labor.
Other supply segments will also see higher costs in coming months, albeit not at the rate of EPCI. “If EPCI players fail to adapt to the rising costs, those executing lump-sum contracts and using outdated assumptions for procurement and construction indices will see their margins squeezed,” says Robert Mathey, analyst and supply chain expert at Rystad Energy. “To mitigate the effects of rising costs, contractors will need to be creative with how they source engineering and procurement services.”
Rystad cautions that operators should expect engineering costs for U.S.-based projects to rise between 3% and 5% next year and by 5% to 8% in 2023, relative to current levels. This projection is consistent with earlier Rystad Energy research pointing toward the growing labor challenges within the oil and gas industry, particularly in attracting and retaining skilled workers.
Projects later in the lifecycle will also feel the effects of increased costs as the impact of global supply chain issues ripple across the energy sector and inflate procurement expenses. “The Port of Los Angeles in California is a fine example: shipments wait to be unloaded, containers remain stacked waiting for trucks to pick up deliveries and, consequently, distribution centers nationwide struggle to fulfill orders,” Mathey says.
Price Increases
Price increases will heavily impact projects requiring large quantities of cable and pipe from U.S. markets. Rystad’s estimates indicate cable prices have risen between 20% and 50% in the past year, while pipe costs have increased 15% to 70%, depending on material. Estimates also show a price increase in higher-level segments of the North American service industry most heavily exposed to raw material increases, notably in processing equipment procurement, which is set to rise 7% by 2023 from current prices. However, if Brent crude oil rises to $100 a barrel, that hike could be closer to 15% by 2023, according to Rystad.
The rise in costs also challenges projects in the construction phase. Construction wages across all industries will increase around 5% by 2023. This trend is set to be more pronounced in the oil and gas industry, with increases expected to be closer to 15%. Construction services constitute nearly half of all EPCI costs and are primarily driven by labor expenses, meaning rising wages could result in more than $1 billion of additional capital expenditure for U.S. oil and gas projects in 2023.
EPCI players have increasingly used high-value engineering centers to carry out more design work, especially as remote working became prevalent during the pandemic. On the procurement front, Mathey points out that companies are also seeking out and validating new suppliers in lower-cost regions to keep projects economically viable.
EPCI companies must be keenly aware of attracting and retaining talent with a worker shortage in the oil and gas and construction industries. “While cost is a significant factor in the success of a construction project, these companies will also need to consider how shortages in skilled labor and worker turnover will impact project schedules, quality and safety,” Mathey concludes.
Reinvestment Rates
Meantime, a separate report from Rystad Energy shows that while costs are increasing, reinvestment rates among public U.S. shale oil producers hit an all-time low in the third quarter, resulting in a record free cashflow for the quarter, and were projected to fall even lower by year’s end. The analysis focused on a peer group of 21 public independent producers, excluding majors, that together account for 40% of the expected 2021 output.
The peer group’s combined reinvestment rate in the third quarter was 46%, down from 53% over the same period in 2020 and far lower than the historical average of 130% (Figure 2). The reinvestment rate is calculated by comparing shale producers’ oil and gas CAPEX budgets against their cashflows from operations (CFO). The CFO of the last quarter was the strongest since the second quarter of 2019.
FIGURE 2
Cashflow from Operations versus CAPEX for U.S. Public Shale Producers ($/billion)
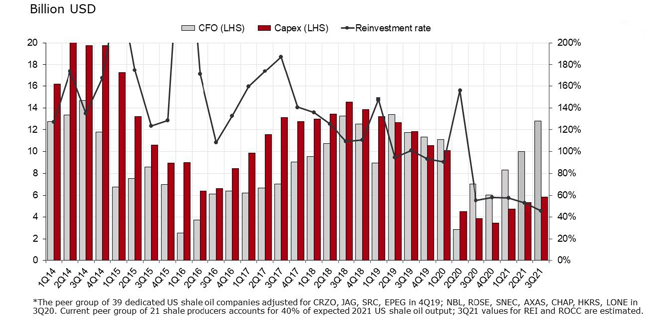
Source: Company reporting; Rystad Energy research and analysis
The analysis shows $7 billion in underspending by shale producers over the third quarter of 2021, comparing oil and gas CAPEX with CFO. Operators managed to slightly increase peer-group quarterly CAPEX in the third quarter to $5.9 billion, up from $5.3 billion in the previous quarter, while further increasing CFO to $12.8 billion. All but one operator balanced spending in the third quarter, reaching a new level of industrywide cash balancing.
“Such a low reinvestment rate stands out, especially as the peer group reported a record-breaking free cashflow and earnings before interest, tax, depreciation and amortization (EBITDA) of $6 billion and $16 billion, respectively,” says Alisa Lukash, vice president for North American shale. “But it is not the end of the reinvestment slide.”
Rystad Energy projections show that reinvestment was on track to fall to 40% in the fourth quarter. Also, for the first time since late 2018, the group’s combined net debt dropped below the eight-year average floor of $52 billion, coming in at $51 billion for the third quarter. Additionally, leverage ratios continued their consistent decline in keeping with the past three quarters.
Ramped Spending
Third-quarter results show several large independent operators ramped spending in line with another financially robust quarter, in part due to the strong recovery in WTI prices. Operators, as expected, started to communicate 7%-15% cost inflation, with much of the impact anticipated to come in early 2022. However, this is expected to be absorbed by improved well productivity and capital efficiencies in most cases.
Combined third-quarter net income for the peer group amounted to $5.3 billion, double the income earned in the second quarter and significantly higher than the sizable losses of $6 billion and $2.1 billion in the third and fourth quarters of 2020, respectively. EBITDA, meanwhile, recovered to $16.3 billion in this year’s third quarter, a level not seen historically. FCF across the peer group was $5.6 billion, a rise of $500 million from the previous quarter and more than double the $2.5 billion seen in the fourth quarter of 2020.
Third-quarter dividend payments jumped by 70% for the peer group versus the second quarter. In comparison, the actual dividend-to-CAPEX ratio increased to 26% compared to 17% in the preceding quarter. Further capital spending control by the industry was aimed at deleveraging and garnering stable shareholder support. Stock buybacks have predominantly been paused as the market recovered naturally with the WTI price increase.
For the first time since late 2018, the peer group dropped combined net debt below the eight-year average floor of $52 billion, reporting $51 billion in the third quarter. Several operators mentioned revised hedging plans for 2022 due to lower expected leverage (many U.S. producers are set to book losses next year on hedge positions set earlier this year on 2022 production).
Both leverage ratios–total debt to assets and total debt to equity–have consistently declined during the last three quarters. Despite more robust stock prices driving total equity up in 2021, the decline in leverage ratios has been partly offset by consistent debt issuance flared by merger and acquisition opportunities in the shale sector.
For other great articles about exploration, drilling, completions and production, subscribe to The American Oil & Gas Reporter and bookmark www.aogr.com.