


Reality Capture
Visualization Tools Maximize Productivity
By Daniel Sawyer and Scott Keller
BUFFALO, N.Y.–Challenges in the oil and gas industry include difficulty in increasing worker productivity while achieving a zero-incident culture, an aging experienced workforce, and global economic pressures. Being able to visualize a digital representation of assets linked to data and documents provides a competitive lever to address these challenges from the toolbox to the corporate boardroom.
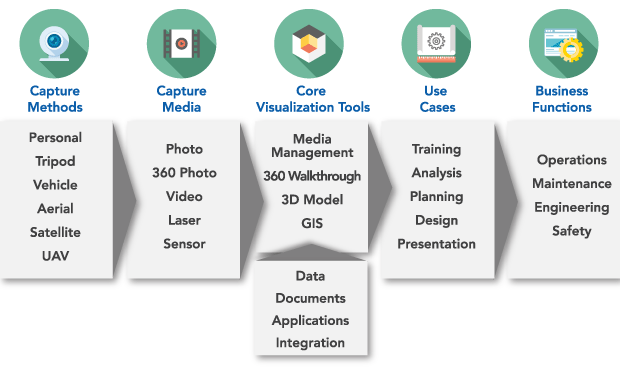
Visualization is the means of organizing, linking and delivering this digital version of assets to workers via the desktop, Web or mobile device in the field. Reality capture is the means to create visualization, which includes everything from simple photos and video to structured capture with 360-degree photogrammetry or laser scanning for creating as-built 3-D models.
The construction industry has found that visualization–as part of building information management (BIM)–has improved concept selection and design, reduced change orders and field rework, and enhanced project delivery with a visual view of sequencing and progress. This use of technology often produces savings of 30 percent or more through reduced changes in requirements from stakeholders and a first-time fit. Visualization can be equally impactful in oil and gas production facilities.
In fact, even small investments in visualization can have an immediate payoff. For remote oil and gas production and processing facilities–whether in the southern Delaware Basin in West Texas or the North Slope of Alaska–a single day spent capturing 360-degree photos can easily provide five times or more value by reducing the costs associated with trips onsite for multiple contractors and teams involved in orientation, planning, design and risk assessment.
The benefits of reality capture and visualization are most dramatic when it exists as an as-built digital environment before work is conceived. As the need for work arises, stakeholders can immediately assess the current condition, operating environment, design concepts, constructability, and risk concerns rather than waiting for teams to be contracted, assembled and deployed to the site, which must occur before they can develop needed reports. Visualization allows the work to come to the people, instead of requiring that people travel to the work. The smaller and more remote the site, the more critical it is to maximize efficiency and manage risk.
The right approach is a selection of reality capture and visualization technologies that will maximize value and produce the highest payback for the asset. A collection of widely separated and remote well locations has very different demands than a 300,000 barrel a day separation facility. The well locations may be captured with a mix of 360-degree photogrammetry and aerial photography combined with the data layers from a geographic information system (GIS) as their core visualization environment. Whereas a large and congested separation facility may realize the greatest value from a combination of laser scanning and 360-degree photography to create an as-built 3-D model using an operations-focused 3-D application as the core visualization environment.
Reality capture and visualization technologies allow the work to come to people, instead of requiring people to travel to the work site. The smaller and more remote the site, the more critical it is to maximize efficiency and manage risk. A single day spent capturing 360-degree photos of a remote oil and gas production or processing facility can provide five times or more value by reducing the costs and risks associated with sending multiple contractors and teams to the site.
Reality capture and visualization combines “typical” platforms of data in databases and document repositories with “visual” platforms such as photo and video management, GIS and 3-D modeling. The combination not only provides intuitive and quick access to information, but can also enable innovative ways of viewing data, such as through augmented or virtual reality.
Because of the variety of platforms and products involved, organizations must have a conscious and coherent visualization plan of action to minimize duplication of effort, ensure they leverage existing reality capture, and adapt to changing technologies. To realize the full value of visualization, they also must maintain a keen focus on the business strategy and support it with a mix of current and future technologies, rather than an information strategy aimed at conforming business workflow to a particular technology.
Reducing Risk
Among the key challenges that visualization helps the oil and gas industry effectively face is achieving zero environmental impact, zero personal injuries, and zero process incidents in an industry that can be inherently dangerous without active risk management efforts that combine the right people, plant, processes and technologies. Any number of incidents greater than zero is a direct (and often material) impact to the bottom line, and unfortunately, the human costs involved can be even greater. Visualization provides a valuable contribution to risk management by exposing the plant and its processes, and enabling people to engage with needed information.
Data and document discoverability is greatly increased when they are linked to equipment and piping in a 360-degree photo or 3-D model visual environment. Operators, maintenance technicians and engineers can easily find and access the information by clicking on the digital asset. This is possible not only for the equipment they are immediately concerned with, but also everything within the physical context of the facility, including equipment and piping upstream and downstream.
While this discoverability may seem to be provided by search engines or other information management tools, the reality is that without a visual context to which to tie them, the results are often incomplete or unsatisfactory to the user. In some instances, it can be impossible to find procedures related to a physical asset in the plant, such as an unnamed and unnumbered valve. In a visual environment, valves can easily be associated with a procedure and even each step in a procedure. Not only can workers find and view a valve referenced in a procedure but it is also possible to systematically know how many and which procedures reference a valve.
Procedures may appear to be complete even when reviewed onsite, but there is always the “unknown unknowns” problem without having a full picture of the physical environment and process systems. A visualization environment can be used systematically to validate the completeness and quality of procedures to minimize risk. When the visualization environment is kept as-built, linked procedures can be readily identified and updated. Instead of relying on periodic reviews, there can be more confidence that procedures are current with the physical state.
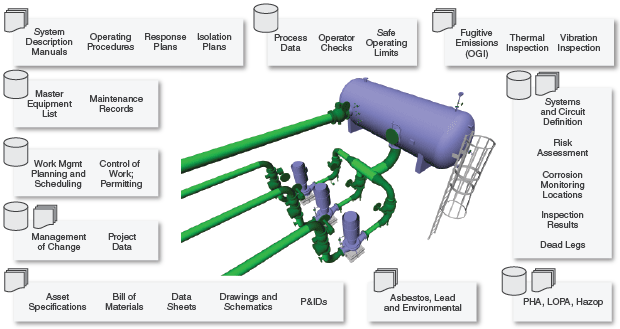
Data and document discoverability is greatly increased when linked to equipment and piping in a 360-degree photo or digital 3-D model. Operators, maintenance technicians and engineers can easily find and access the information they need by clicking on the digital asset. This is possible not only for the equipment they are immediately concerned with, but also everything within the physical context of the facility, including upstream and downstream equipment and piping.
Visualization ensures that procedures for high-risk but low-frequency activities are not only readily accessible, but also are reviewable by experts located offsite alongside the physical context. This increases the likelihood that these procedures are effective and the asset can be efficiently and safely returned to production.
Ultimately, the management of risk is the process of making informed decisions. When everyone has the visual context of risks and mitigations on demand, they are better positioned to be engaged and question assumptions, and managers can exercise more informed and effective oversight.
Boosting Productivity
While risk reduction is always top-of-mind, the oil and gas industry is also challenged to increase productivity. Despite continuous investments in information technology urged on by the hot buzzword of the day, workers are often still compelled to spend a majority of their time on mundane and low-value tasks such as discovering, gathering, verifying, crosschecking and manually sharing data and documents. Visualization can help free workers to focus on high-value endeavors, including analysis, design, planning and decision making.
Given the natural human ability to visually identify, link and follow spatial relationships, visualization should be an important part of any strategy to increase productivity. This inherent capability can be extremely difficult for information systems to match. Whereas, 360-degree photography or a 3-D model visualization system is immediately understandable and navigable by everyone with clear value. Compared to other information systems initiatives, visualization has an immediate return while also requiring a smaller investment in time from the worker to become proficient. The ability to use our inherent spatial awareness in a system to locate, view and analyze data is powerful.
Historically, this value had to be derived from diagrams, drawings and schematics. These traditional tools will always be essential to be able to show information succinctly. However, many can be improved upon or generated more efficiently and effectively through a 3-D visualization environment, which also provides a richer set of data and documents within the physical context.
Leveraging the context that visualization provides can also reduce cross-functional barriers and departmental self-optimization by increasing visibility, communication and collaboration. This creates a positive feedback loop by continuing to bring in data and documents that may have been hiding in silos as additional workers used them. Additional information that may be integrated into the visualization environment through increased collaboration could include such items as vibration data, fugitive emission videos and reports, thermal inspection results, specifications and bills of materials.
Of the different visualization methods, an as-built 3-D model created from laser scans combined with 360-degree photography has distinct productivity advantages. The ability to selectively view assets or any part of a system from any angle within a model is not something that can be done onsite or using photography. A 3-D model that provides system context and interfaces is often a prerequisite for maximizing the value of other current and emerging technologies such as industrial internet of things (IIoT), machine learning and augmented reality.
Maximizing Efficiency
Global long-term financial challenges for the oil and gas industry include volatile commodity prices, greater regulation over the long term, experienced workers retiring, boosted demand for connected information, cost of goods and services, contractor management, and pending government mandates. There is not a single market that can escape these realities. Even producers with historically low-cost production are investing in technology to maximize productivity and efficiency.
Lowering the total cost of ownership is a competitive necessity, and if the time to leverage visualization for brownfield assets is today, then the time to leverage it for greenfield assets was yesterday. This applies not only to design and construction, but also to ongoing operations and eventually decommissioning. As an example, it makes much more sense to use a 3-D as-built model integrated with an integrity management system for a multibillion-dollar asset rather than to separately generate tens of thousands of piping isometrics, which are standalone documents that each need to be maintained. The integrated 3-D model has lower generation and handover costs and provides an ongoing cost reduction compared to standalone documents throughout the life of the asset.
Visualization for ongoing operations may initially be viewed as a large additional cost, but functions more as a cost optimization or transfer with substantial benefits. Significant amounts are likely already spent on reality capture through photos, video, manual drawings and sketches, creating fixed isometric drawings, and even laser scanning either directly or indirectly through contractors. Ultimately, without an overall visualization strategy, much of these activities and costs are duplicative, one-offs that are not maintained, or cannot be leveraged effectively across the organization.
A reality capture and visualization strategy is within the reach of every organization and is becoming critical to face the complex challenges facing the oil and gas industry. For organizations that are interested in realizing the benefits of visualization, there are three key considerations to keep in mind.
First, companies should begin with the assumption that everyone in their organizations can leverage visualization. While it may be necessary to prioritize deployment to a group with high-risk or high-value benefits, everyone (even contractors and vendors) should be included in the assessment and overall strategy.
Second, it is critical to ensure that an implementation will enable the linking of all data and documents related to physical assets, that management of change processes incorporate reality capture, and that the visualization platform is integrated into existing engineering information management systems.
Finally, the focus should be on capabilities and platforms, rather than a collection of specific products. Products will vary and there will be a range of fit-for-purpose applications used internally and externally, which will use the reality capture data as input.
Delivered within a business-first strategy that leverages technologies to empower workers to expand their knowledge and leverage their experience, visualization will provide the basis for a transformational improvement to productivity, risk management, and ultimately, the bottom line.

Daniel Sawyer is a principal consultant at Computer Task Group. With more than 20 years of experience delivering information technology in oil field support services, he has been a contract consultant on a 3-D visualization initiative for a major oil company in Alaska since 2013. Sawyer’s expertise is in deploying cost-efficient technology with a focus on user workflow to increase business productivity.

Scott Keller is a principal consultant at Computer Task Group. Since 2010, he has been the lead contract consultant on a 3-D visualization initiative at a major oil company in Alaska. With more than 30 years of leadership experience as a founder, executive and consultant with teams that apply expertise to real business value, Keller specializes in effectively applying new technology to minimize cost, improve efficiencies and add overall value to the bottom line.
For other great articles about exploration, drilling, completions and production, subscribe to The American Oil & Gas Reporter and bookmark www.aogr.com.