


Natural Gas Exports
Wahalajara Pipeline Boosts U.S. Gas Exports To Mexico
Exports of natural gas to Mexico by pipeline are the largest component of U.S. natural gas trade, accounting for 40% of all U.S. gross natural gas exports in 2019, according to the U.S. Energy Information Administration.
The agency says it expects U.S.-to-Mexico exports to increase with the completion of the southernmost segment of the Wahalajara system, the Villa de Reyes-Aguascalientes-Guadalajara (VAG) pipeline, which began operations in June.
Meanwhile, notes a separate analysis released by the American Petroleum Institute, U.S. liquified natural gas exports are helping cut global greenhouse gas emissions.
Exports By Pipeline
The Wahalajara system is a group of new pipelines that connects the Waha hub in the Permian Basin to Guadalajara and other demand and population centers in West-Central Mexico. “Wahalajara provides U.S. natural gas to meet growing demand from Mexico’s electric power and industrial sectors,” EIA says in a July 6 report. “With the 0.89 billion cubic feet a day VAG pipeline entering service, we expect utilization of the Wahalajara system to quickly ramp up, resulting in increased U.S. gas exports to Mexico out of West Texas and additional takeaway capacity out of the Permian Basin.”
FIGURE 1
Monthly U.S. Natural Gas Exports to Mexico (Bcf/d)
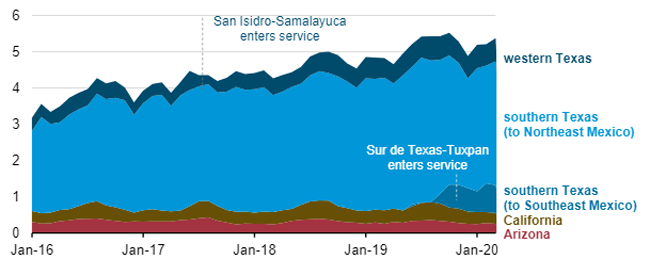
Source: EIA.
Mexico has been expanding its natural gas pipeline system since 2016, which EIA notes has supported continual growth in U.S. natural gas exports (Figure 1). Most of this growth has been in U.S. exports from southern Texas following expansion of existing U.S. pipeline infrastructure and completion of the Los Ramones Phase II pipeline in Central Mexico.
After the Sur de Texas-Tuxpan pipeline was completed in September 2019, U.S. exports to Mexico reached a record 5.5 Bcf/d in October 2019. However, EIA reports, exports from the border at Brownsville, Tx., to Veracruz in southeastern Mexico averaged only 0.6 Bcf/d during the fourth quarter of 2019, representing 20% of the pipeline’s capacity.
Overall, U.S. natural gas exports from this region increased a mere by 0.2 Bcf/d between 2016 and 2019 because of delays in pipeline construction in Mexico, the agency relates. In particular, two regional pipelines were completed in 2017 but have not come close to utilizing most of their capacities: the 1.1 Bcf/d Comanche Trail pipeline that delivers natural gas to Mexico from San Elizaro, Tx., and the 1.4 Bcf/d Trans-Pecos pipeline that crosses the border at Presidio, Tx.
Comanche Trail has been delivering an average of only 0.1 Bcf/d of natural gas to Mexico since the San Isidro-Samalayuca pipeline entered service in June 2017. Pipeline operators do not expect flows to rise until the 0.47 Bcf/d Samalayuca-Sásabe pipeline in Mexico is completed in late 2020/early 2021, according to EIA.
Meanwhile, the agency says, the Trans-Pecos pipeline, the U.S. segment of the Wahalajara system, did not transport significant gas volumes until October 2018, and is currently operating at only 10-15% of its capacity.
Most of the demand centers are in southern Mexico, waiting to be connected to the VAG pipeline, EIA explains, adding that three of the project’s four pipelines in Mexico now are in service:
- The 1.4 Bcf/d Ojinga-El Encino, which entered service in June 2017;
- The 1.5 Bcf/d El Encino-La Laguna, which entered service in January 2018; and
- The 1.2 Bcf/d La Laguna-Aguascalientes, which entered service in December 2019.
Before the COVID-19 outbreak, S&P Global Platts expected U.S. gas exports to Mexico to increase immediately by 0.3 Bcf/d on the Wahalajara system. “However, given the decreased demand for natural gas in Mexico in response to the economic impact of COVID-19 mitigation efforts, growth is likely to be slower than expected,” the report reads. “Beyond these volumes, additional export volumes will be limited by how quickly customers in Mexico can be connected to the pipeline.”
These connections include new gas-fired, combined-cycle generators and the scheduled 2020 completion of the 0.89 Bcf/d Tula-Villa de Reyes pipeline, which will deliver gas to central Mexico. As U.S. gas exports on the Wahalajara system rise, prices at the Waha hub, which have been steeply discounted relative the Henry Hub benchmark, are expected to continue to strengthen, EIA projects.
LNG Cuts GHG
Looking at U.S. natural gas exports from a different angle was a study API released on July 9. The report, which was conducted by researchers at ICF, examines the environmental benefits of U.S. natural gas use in China, Germany and India, and finds that using U.S. LNG instead of coal to generate electricity slashes the resulting GHG emissions by an average of 50.5% in all analyzed base case scenarios.
“This study underscores what we have known for quite some time–that U.S. natural gas is a far cleaner option than coal for electricity generation, especially in key markets in China, Germany and India,” remarks API Director of Market Development Dustin Meyer. “U.S. LNG exports can help accelerate environmental progress across the globe, enabling nations to transition to cleaner natural gas to reduce emissions and address the global risks of climate change.”
Looking at cases in China, Germany and India, the study, “Update to the Life-Cycle Analysis of GHG Emissions for U.S. LNG Exports,” demonstrates the importance of natural gas for achieving global emissions reductions, API says. In China, coal still makes up 66% of power generation. In India, it’s 74%, and in Germany, it remains high at nearly 30%.
API observes that coal’s share of U.S. power generation has fallen from roughly 50% in 2005 to 24% in 2019, while natural gas generation has grown from 19% to nearly 40% during the same period. This transition has been instrumental to the United States reducing emissions in the power sector by 25% from 2008 to 2018.
Among the study’s other key findings that API highlights are the percentage decreases in emissions from the use of U.S. LNG versus U.S. and domestic coal:
- In China, U.S. LNG delivers 49% fewer emissions than U.S. coal and 48% fewer emissions than Chinese coal.
- In Germany, U.S. LNG delivers 53% fewer emissions than U.S. coal and 51% fewer emissions than German coal.
- In India, U.S. LNG slashes GHG emissions by 48% in comparison with both Indian and U.S. coal.
The study reveals that transportation and shipping distance have the least impact on supply chain emission levels, accounting for only a tenth of the total GHG supply chain emissions. API says this demonstrates that the export journey for U.S. LNG has a limited environmental impact.
Similarly, API says the report shows that export and import terminal operations also account for only a tenth of the total GHG supply chain emissions.
For other great articles about exploration, drilling, completions and production, subscribe to The American Oil & Gas Reporter and bookmark www.aogr.com.