


Natural Gas Update
Winter Weather Weighing Heavily On Market
WASHINGTON–Cold weather, increased consumption in the power generation and industrial sectors, and higher export volumes combined to drive record daily natural gas demand to start 2018, according to the U.S. Energy Information Administration.
Estimated U.S. natural gas demand on Jan. 1 reached 150.7 billion cubic feet, surpassing the previous single-day record of 143.3 Bcf set on Jan. 7, 2014. Colder-than-normal temperatures across much of the United States led to increased natural gas demand for residential and commercial heating, but EIA notes that residential and commercial consumption did not appear to surpass previous peaks (Figure 1).
“Higher consumption in the electric power and industrial sectors, greater exports of natural gas to Mexico, and more demand for liquefied natural gas feedstock gas contributed to the recent record demand level,” the agency stated in a Jan. 5 release.
FIGURE 1
Daily U.S. Natural Gas Consumption and Exports
(1-1-13 to 1-4-18)
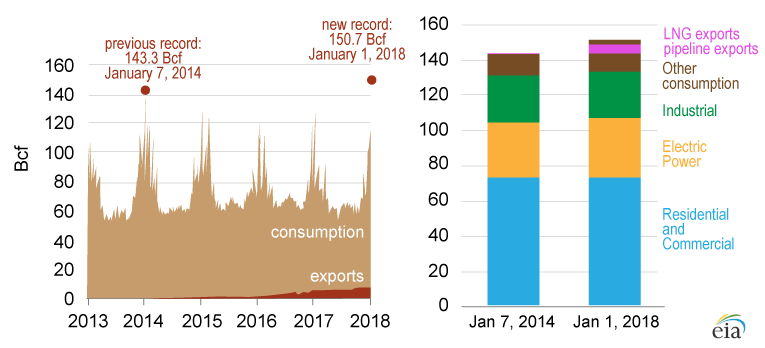
Source: U.S. Energy Information Administration, based on PointLogic.
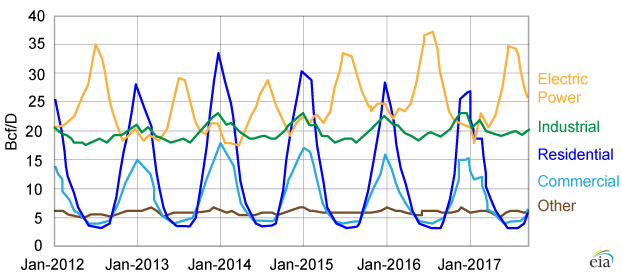
FIGURE 2
U.S. Natural Gas Consumption by Sector
(January 2012-October 2017)
The freezing temperatures throughout the East Coast, Midwest and Atlantic regions during the first week of the new year also led to the largest weekly withdrawal from natural gas storage, EIA reported on Jan. 11. Working gas in storage decreased by 359 Bcf for the week ending Jan. 5, the agency says, easily topping the previous record weekly withdrawal of 288 Bcf in early January 2014.
Natural gas consumption remains highest in the winter months when residential and commercial heating loads are greatest, but increased consumption in gas-fired electricity generation has created new summertime consumption peaks for electric power (Figure 2). Industrial sector consumption of natural gas is relatively less seasonal, but also tends to be higher in winter months, EIA explains.
“Although the electric power sector consumes the most natural gas during summer months, when overall electricity demand is highest, power sector consumption of natural gas can also increase in winter months,” the agency explains. “Many homes and commercial buildings use electricity either as their primary or secondary heating fuel, and overall increases in electricity demand are often met by natural gas-fired generators.”
The record demand levels to start the year also led to new highs in city gate pricing, with New York City setting an all-time spot natural gas price of $140.25 per MMBtu in non-inflation adjusted dollars on Jan. 5, according to EIA. Day-ahead natural gas prices for Jan. 1 delivery neared $30 per MMBtu at trading locations in the Mid-Atlantic region, New York and Boston, according to Natural Gas Intelligence. Because the spot price of natural gas impacts power prices in many parts of the United States, spot wholesale electricity prices also rose, surpassing $200 per megawatthour in New York City and $185/MWh in New England, according to data from SNL Energy.
During the previous record withdrawal (288 Bcf) for the week ending Jan. 9, 2014, U.S. population-weighted heating degree days reached 255. For the week ending Jan. 5, heating degree days were estimated at 281. The 359 Bcf drawn out of storage left 2.77 trillion cubic feet of working gas in inventory, 415 Bcf less than at the time last year and 382 Bcf below the five-year average of 3.15 Bcf, according to EIA’s Weekly Natural Gas Storage Report.
Given high spot natural gas prices, oil-fired generation still accounted for more than 30 percent of the overall fuel mix in the New England region in early January, EIA data show. As of Dec. 29, Northeast distillate stocks were estimated at 38.7 million barrels, 4 percent above the five-year average but 14.4 million barrels below year-ago levels.
Forecast Turns Warmer
However, even as temperatures in the Northeast region were averaging 8-12 degrees colder than normal, EIA reported that the Henry Hub spot price fell 38 percent between Jan. 5 and Jan. 8. The reason was a warming trend forecast to extend from mid- to late January, which the agency said could significantly impact natural gas consumption, natural gas and electricity prices, and ultimately, end-of-season storage inventories–especially when combined with projections of ongoing robust U.S. gas production growth.
In October, the latest month available in EIA’s analysis, both U.S. dry natural gas production and natural gas consumption jumped to record levels for the month. Dry production increased year-to-year for the fifth consecutive month, reaching 2.33 Tcf, or 75.1 Bcf/d. This was 3.7 Bcf/d (5.2 percent) higher than in October 2016, when U.S. output averaged 71.4 Bcf/d.
Growth in associated natural gas production in tight oil plays was a key force behind surging supplies in 2017, EIA reports. According to the agency, oil-focused shale basins delivered 3.9 Bcf/d of new gas production in the 12 months between December 2016 and December 2017, with a little more than half of the total coming from the Permian Basin alone.
Meanwhile, estimated natural gas consumption in October was 2.035 Tcf, or 65.6 Bcf/d. This level was 3.5 Bcf/d (5.7 percent) higher than the 1.93 Tcf consumed in October 2016.
“Dry natural gas production for October was the highest for the month since EIA began tracking monthly dry production in 1973,” the agency noted. “Natural gas consumption for October was the highest level for the month since EIA began tracking monthly consumption using the current methodology in 2001.”
Year-over-year total consumption of dry natural gas increased in each of the four consuming sectors in October. As reported by EIA, deliveries of natural gas by sector during the month included:
- 203 Bcf (6.5 Bcf/d) of residential deliveries, up 8.6 percent from 6.0 Bcf/d in October 2016 and the highest for the month in three years;
- 200 Bcf (6.5 Bcf/d) of commercial deliveries, up 4.7 percent from 6.2 Bcf/d in October 2016 and also the highest in three years;
- 653 Bcf (21.1 Bcf/d) of industrial deliveries, up 5.0 percent from 20.1 Bcf/d in October 2016, reaching the highest October level since EIA began using the current definitions for consuming sectors in 2001;
- 784 Bcf (25.3 Bcf/d), up 5.8 percent from 23.9 Bcf/d in October 2016, representing the second-highest level for October since 2001; and
- 8.9 Bcf/d of total exports, an increase of 56.3 percent from the 5.7 Bcf/d in October 2016 (driven by LNG exports, which averaged 2.6 Bcf/d to 10 different countries in October–more than 25 times higher than the year earlier).
For other great articles about exploration, drilling, completions and production, subscribe to The American Oil & Gas Reporter and bookmark www.aogr.com.