


Part 1
Project Optimizes Completion Design Part 1
By Jessica Barhaug, Victoria Martinez King, Andrew Schmidt, Angie Southcott, Lee Steinke and Harold Harper
DENVER–The ability to optimize completions has been mainly an expensive trial-and-error process in the Williston Basin. Seeking to maximize completion performance and economics in Bakken/Three Forks horizontal wells, WPX Energy conducted a comprehensive two-phase project to first gather and analyze data to design an optimized completion, and then perform a field trial to confirm results using the optimized design.
By varying completion and isolation styles on a select set of wells and obtaining a wide range of data, an optimized design was obtained at a fraction of the cost, including isolation type, job size, stage length, number of entry points, entry type, perforation scheme, and rate. In phase one of the project, an S-shaped pilot well was drilled for core, specialty logs, diagnostic fracture injection tests, and microseismic monitoring.
A combination of sliding sleeves, rapid frac sleeves, and plug-and-perf completion methods were used across two open-hole, adjacent laterals. Two cemented laterals that were initially horizontal monitors were used to test proppant volumes per stage and numbers of clusters. A tracer program was designed to examine stage isolation and well-to-well communication. Hydraulic fracture pressure history matching (FPHM) was done on all stages, allowing propped fracture area and proppant concentration trends to be broken out by completion and isolation type.
A cemented, three entry-point, plug-and-perf design was the clear winner. The FPHM and microseismic analysis demonstrated that this design reduced out-of-zone frac height growth and tracer results showed it minimized stage-to-stage and well-to-well communication. Multivariate analysis suggested an optimal stage length and pounds of proppant per foot. Using the results from all the datasets, the optimized completion design was input into the calibrated fracture model to forward model the predicted fracture geometry.
The second phase of the project was implemented then to test the effectiveness of the new design and the applicability of the calibrated fracture model. A microseismic and tracer (water, proppant and oil) program was executed and FPHM was conducted. FPHM showed that actual fracture geometries were very close to what the model had predicted, and microseismic and tracer data indicated greater in-zone frac height containment. In addition, production exceeded the predictive models from multivariate analysis.
The project not only resulted in an optimized completion design, but also provided valuable insights beyond the completion design itself. Numerous lessons were learned about data acquisition and how to improve data quality on future projects. Fracture azimuth was confirmed with microseismic and tracer data. The effects of depletion could be seen by the datasets as well. FPHM outputs also provided insights into out-of-zone frac height growth being attributed to higher rates and fewer entry points. The importance of water-to-oil ratios was evident with multivariate analysis as well.
Phase One
Understanding the results of various hydraulic stimulation techniques requires understanding the local geology. Specifically, geomechanical properties play a role in how a target objective behaves and accepts the completion procedure. Geomechanical properties can be quite variable in sedimentary rocks, depending on the vast combinations of various sedimentary and lithological characteristics. Relative differences and thickness variations of interlayered Bakken/Three Forks units define how effectively stimulations can be propagated and contained.
Quartz content, clay content, organic content, rock fabric, maturity, and fluid pore pressure gradient all can be important aspects of geomechanical variability within Upper, Middle and Lower Bakken units. An additional layer of complexity is the interdependency of these variables. WPX Energy has measured many of these components for this area in the Williston Basin.
A full characterization effort is under way, but is still in the preliminary stage. Realizing this sort of effort would be a long-term proposition, WPX chose to conduct near-term experiments to gain insights into completion optimization before having full knowledge of the components that should ultimately explain the “why.”
For the initial phase of the study, specialty log, core and microseismic data were acquired in four laterals with varying completion and isolation types, and in the S-shaped well. Table 1 depicts the role that each well played in the first phase.
TABLE 1
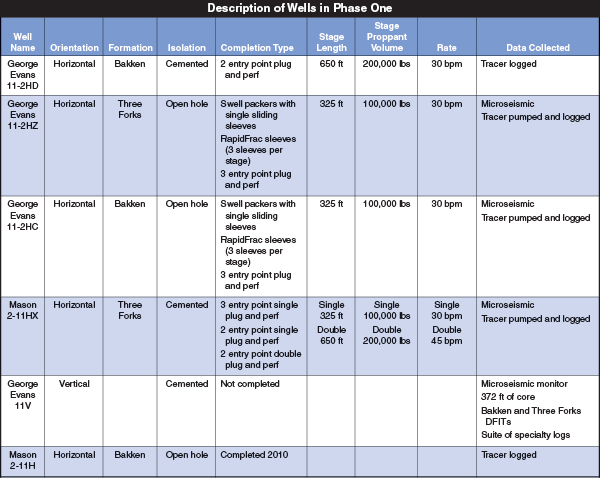
All the completed stages used a hybrid fluid system with 24-pound linear guar gel for the pad and 100-mesh sand stages, transitioning to a 24-pound cross-linked guar gel for the 20/40-mesh sand and 20/40-mesh intermediate-strength proppant (ISP) stages. A mix of 35 percent 20/40 sand and 65 percent 20/40 ISP was used on all stages. The two entry-point, double-cemented stage was the standard completion design at the time the study was conducted. This meant a total of 16 stages with 31 entry points for a 9,500-foot effective lateral.
The completion design optimization process undertaken in phase one had several steps, including:
- Empirically comparing interpreted fracture behavior in test wells using microseismic data, proppant tracer data, and FPHM analyses;
- Determining the analyses of some preferred design components;
- Using multivariate statistical analysis to identify constraints for additional design components;
- Filling out remaining design components using forward fracture modeling; and
- Estimating the economic impact of the new completion design.
The analyses, design components and target metrics have numerous and complex interrelationships and interdependencies. The success of each step depended on carefully reviewing data, geologic assumptions and methods, as well as acknowledging uncertainties. The datasets contributing to the final optimized completion design were microseismic, hydraulic fracture modeling, multivariate analysis, and tracer diagnostics (each data type has certain strengths and weaknesses, underscoring the importance of integrating different datasets).
FIGURE 1
Phase One Layout and Microseismic Rounds
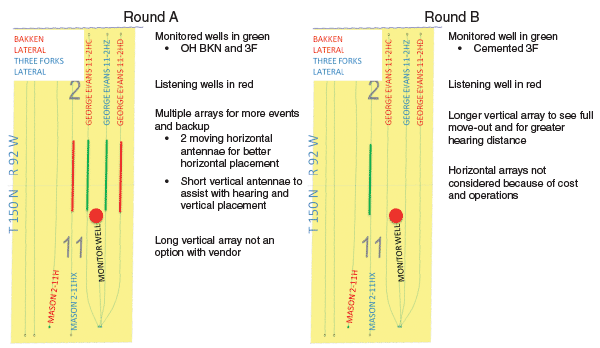
The phase one microseismic program was completed in two rounds (Figure 1), with each round acquired and processed by a different vendor. The horizontal monitoring wells in round A used a 19-tool DS150 downhole array, and the vertical observation well used a 24-tool, 12-level partially stacked DS250 array. Both lateral and vertical arrays were 900 feet long, and were oriented using perforation shots and ball seats. During completion of the treatment wells, horizontal arrays were moved after every other stage to keep them centered on the stages being completed. All but three of the 56 completed stages were monitored, with 3,500+ events located.
Round B monitored the Mason 2-11HX, a cemented Three Forks lateral that was used as a monitoring well in round A. The only monitoring well was the George Evans 11V. The vertical observation well used a 50-tool DS150 sensor array with 49.2-foot spacing between levels. All but one of the 19 completed stages were monitored, and 550+ microseismic events were located.
Each stage of microseismic data was scrutinized individually to ensure events were representative before any conclusions were made. Information from the core, 3-D seismic, tracer data, and wellbore placement in the zone were considered in interpreting microseismic.
A dominant fracture direction of north 60 degrees east was observed, as well as a secondary perpendicular trend in some areas. The primary trend’s dominance varies, as does fracture coverage along the wellbore. Some areas are densely populated with events, while others appear to have been left untreated. Not all stages appear to have a fracture. Some stages’ events pile on top of other stages’ events, leaving gaps in coverage that suggest poor stage containment. Faults interpreted from 3-D seismic data were shown to influence the behavior of microseismic event patterns, giving a higher confidence in microseismic event locations.
FIGURE 2
Microseismic Events from Select Stages of Phase One
(Grid Cell Size = 250 x 250 feet)
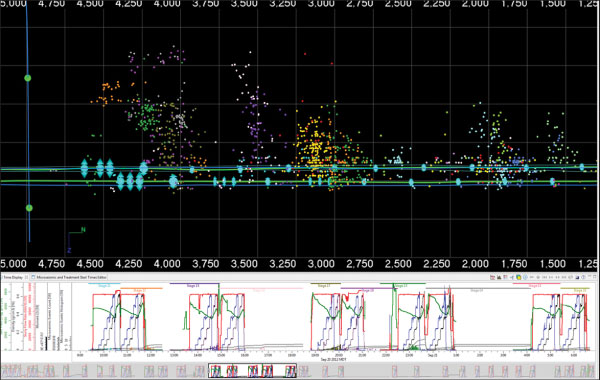
Significant vertical height growth was common for all completion types. Figure 2 is a south-to-north cross section showing all microseismic events (colored by stage) from the George Evans 11-2HZ Three Forks (sliding sleeve stages 9-18) and the George Evans 11-2HC Bakken (sliding sleeve stages 4-14) stimulations. Most events go upward out of zone into the Lodgepole. The average height growth from the Three Forks well was 600 feet in round A and 300 feet in round B, highlighting the differences between how the rounds were acquired and processed.
The microseismic data influenced the selection of preferred isolation type, entry-point type, and perforation scheme through an analysis of vertical and stage containment. Both stage containment (i.e., a fracture is interpreted in a qualitative sense to have occurred at or near the intended stage and stages are not missed along the lateral) and vertical containment (i.e., quantitatively keeping the fracture in the Bakken and/or Three Forks) parameters are important measures of success in controlling the energy of the hydraulic fracturing job.
Hydraulic Fracture Model
FIGURE 3
Minimum Horizontal Stress
And Pore Pressure Iterations
(Final Curves = Red ‘Model E’)
The project used the GOHFER® planar 3-D geometry fracture simulator to analyze the effect that varying completion types has on different frac properties, such as average proppant concentration, fracture height, propped fracture half-length and the propped fracture length area (PFLA). The PFLA was calculated by multiplying propped fracture length by the net pay height of the formation. In the phase one wells, the Middle Bakken thickness is 32 feet and the oil-saturated zone of the Three Forks is 50 feet.
Other than frac data, the main inputs into GOHFER were the petrophysical and geomechanical models. The final pore pressure and minimum horizontal stress curves used in the GOHFER modeling are shown in red in Figure 3 (Model E) along with the various iterations that were tested before arriving at the final model.
With the petrophysical and geomechanical model determined, fracture pressure history matches could be conducted on the wells. FPHM was performed on all 75 stages of the three wells that had additional data collection (excluding the George Evans 11-2HD). The high number of matches provided a large dataset that could be used to look at completion and isolation type trends on hydraulic fracture properties. Each completion and isolation type combination was analyzed and an overall average of the combination was examined to identify the best completion design moving forward.
The hydraulic fracture model was used to determine preferred isolation and entry-point type, as well as perforation scheme, by analyzing vertical containment and PFLA. Forward modeling with different combinations of rates and perforation schemes set the preferred number of effective perforations per stage and treatment rate.
Multivariate Analysis, Tracers
Multivariate analysis using a non-linear regression algorithm provided preferred stage length, proppant volume and treatment rate for the final design. The technology enables the interpreter to understand how a number of variables impact a response variable, and how impactful each variable is. In addition, multivariate analysis provides a transformed variable trend that shows the relationship of each variable to the response variable (for example, how lateral length relates to production).
The first steps in the analysis process were to quality check the dataset and remove outliers in the data. A multicollinearity analysis was performed to ensure that variables were not too closely related. The next step was to define whether the relationship of the transformed variables was linear, monotonic, periodic, or higher order. The model then could be run with iterations using various variables and combinations of variables.
Each resulting transformed variable should be scrutinized and justified prior to using the model and predicted response. Once the overall correlation and the selected transformations of the variables have been selected, the information is ready to use in forward modeling scenarios. In this case, cumulative production after 180 days was chosen as the response variable in the multivariate analysis because of the strong, positive relationship (r2=0.885) between cumulative production after 180 days and estimated ultimate recovery.
Completion variables used in the multivariate analysis included lateral length, stage lengths (plug-to-plug or sleeve-to-sleeve), proppant volume per foot, proppant type, and treatment rate. These variables were controlled easily by the frac design, they had known measureable values, and available public data could be incorporated from third-party operators. The transformed variable trends also were supported by other datasets.
Proppant tracers (iridium, scandium and antimony) were pumped to evaluate well-to-well proppant communication as well as stage containment. Proppant tracer was pumped strategically in the sand-laden portion of the frac on three wells. All three were logged with Core Labs’ SPECTRASCAN™ spectral gamma ray tool, along with two additional wells that were logged specifically to evaluate well-to-well proppant communication. Proppant tracer placement took place over the course of three weeks. Logging was performed on all five wells beginning three weeks after completing the fifth and final well’s stimulation.
After accounting for some overlapping operations, the proppant tracer work occurred over the course of about two months. Because of the nature of multiwell pad completion operations and the associated cost/timing considerations, the five wells were subjected to differing amounts of activity within the unit boundary subsequent to proppant placement, but prior to being logged. As a result, these orchestration issues did introduce some additional uncertainty.
Tracer data were used to choose preferred isolation and entry-point type through analysis of stage containment, and matching perforation schemes with proppant volumes based on well-to-well communication and analysis. Anecdotal information on vertical containment also was provided when offsetting wells in different formations communicated.
Integrated Analysis
After gaining insights on the individual datasets and the answers they could provide, the datasets were integrated to provide completion effectiveness answers. Each component of what constitutes an optimized completion was examined, including isolation and entry-point type, stage length, proppant volume, perforation scheme and treatment rate. The components incorporated into the final design were isolation and entry-point type, perforation scheme, stage length, proppant volume, and treatment rate.
Microseismic was one of the supporting datasets that led to the ultimate decision to select plug-and-perf cemented laterals over other isolation and entry-point types. Vertical containment was broken out for every stage of phase one wells by looking at the percentage of a stage that stayed within the pay zone and the percentage that grew out of zone.
For example, in Figure 3, an average of only 14 percent of the events are in zone. An average of vertical containment was calculated for each isolation type and entry-point type combination. This analysis showed that cemented liners were superior to their open-hole counterparts.
FPHM results were in agreement with this component of the microseismic data, showing that plug-and-perf cemented laterals were superior to open hole when broken out by isolation type, completion type and job size for average proppant concentration within the hydraulic fracture and average PFLA.
FIGURE 4
Phase One Proppant Tracer Results for Isolation Type
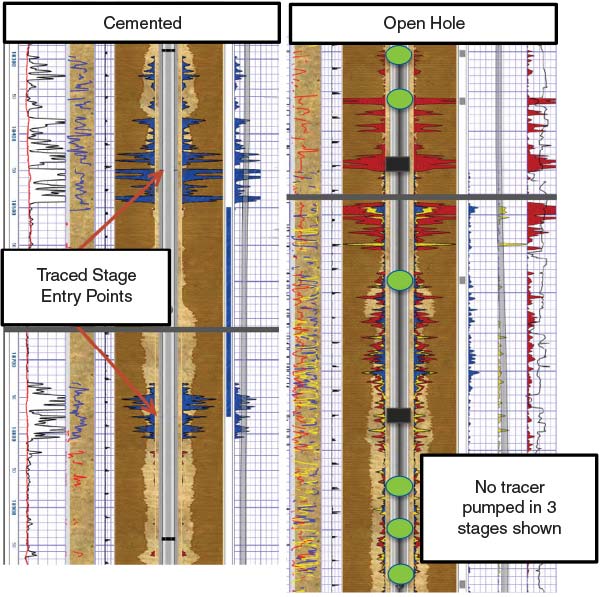
Proppant tracer data further confirmed the findings (Figure 4), showing that proppant tracer was mostly confined around the entry points (blue shading) on cemented stages, demonstrating that the cemented lateral was doing a good job of providing stage containment. In contrast, the log labeled “open hole” (the green circles are sleeves and black squares are swell packers) shows red, yellow and blue tracer smeared across this log section, but no tracer was pumped in this stage. This may indicate that the swell packers were not providing adequate stage containment. Every stage with proppant tracer was assigned a penalty depending on the interpreted amount of stage containment. The bar graphs are a summary of that analysis.
Similar interpretive scoring of microseismic data provided different results. Although it is possible that tracers logged and interpreted at various locations were from wash-ins or offset wellbores rather than poor stage containment, the uncertainty in the microseismic interpretation was deemed greater for this analysis. Those results may be related to differences between the processing of the two microseismic datasets.
It was also difficult to determine whether microseismic events early in a stage were actually relaxation or “hangover” events from the previous stage, or indications of poor stage containment. Clearly missed and overlapping stages in the open-hole laterals in round A microseismic data lend support to the overall proppant tracer results that show superior containment in cemented laterals.
The final component of the isolation type and entry-point type conclusion was risk. WPX Energy had experienced some catastrophic failures with open-hole sliding sleeves. There had been instances where a casing failure occurred in the heel of a lateral, with proppant tracer confirming the location. This meant drilling out all the sleeves and either completing the well using a coiled tubing frac or leaving a section of the lateral unstimulated. Because of capital constraints, WPX Energy has a handful of wells with less than half of a completed lateral because of casing failures. Consequently, cemented plug-and-perf completions were compared with open-hole sliding sleeve and plug-and-perf wells from a risk standpoint.
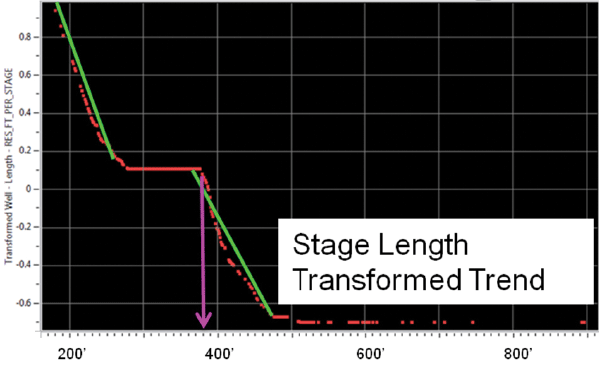
Stage Length
Multivariate analysis was used to determine the recommended stage length or number of stages for a well. Stage length was used in the multivariate analysis instead of number of stages because of the close relationship to number of stages and lateral length in the dataset. The stage length has a negative monotonic trend, meaning that more stages increase the response variable. There is a plateau in the trend between 280 and 370 feet (Figure 5A). This plateau could be present because a variable or combination of variables need to be added to the analysis to smooth the data, or there may be little or no benefit to reducing stage length from 370 to 280 feet.
FIGURE 5A
Stage Length versus Transformed Stage Length
(Multivariate Analysis)
Additional operational risk is assumed with more stages and perforation runs as well as added cost for the extra time needed to frac each well. Taking into account the improved performance and additional risk and cost that goes along with additional stages, the recommended completion design went from 16 to 25 stages per well, or approximately 600 to 380 feet per stage.
The GOHFER model also indicated that a decrease in stage length was necessary, with double cemented plug-and-perf stages having a higher PFLA than single stages. Theoretically, however, one would expect the PFLA of a double stage to be double that of a single stage. This was not the case; a double stage was only 12 percent better than a single stage. This indicated that with the double-stage methodology being used, PFLA was being left behind. In order to increase PFLA, stage length had to be reduced.
The increased number of stages was expected to reduce the frac length and improve the quality of the stimulation around the wellbore. The stage count may seem low compared with other Bakken operators, but the cemented lateral production strings and limited-entry stimulations generate more than one fracture per stage. The change in stage count is also large enough to see a change in the performance indicator.
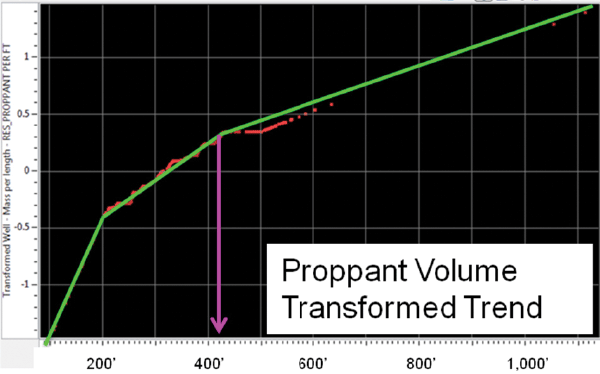
Proppant Volume
Multivariate analysis also was used to determine a recommended proppant volume, which proved to be the most impactful completion variable analyzed. The transformed proppant volume per foot has a positive monotonic trend. There is a decrease in slope after about 435 pounds a foot, implying that incremental proppant is not as impactful after that volume, but is still beneficial (Figure 5B). The change in slope also could be an artifact in the transformation as a result of not including every impactful variable/variable combination in the analysis, or there could be less benefit to increasing proppant volume from a performance standpoint.
FIGURE 5B
Proppant Volume versus Transformed Proppant
Volume (Multivariate Analysis)
WPX Energy’s design prior to data acquisition and analysis was 3.3 million pounds of proppant for a long lateral, or about 350 pounds/foot. The recommended design derived from the multivariate analysis was 425 pounds/foot, or 4 million pounds of proppant per well. This change is expected to yield statistically improved results, but may not be fully optimized for economics. Additional work and testing are needed to fully optimize this variable.
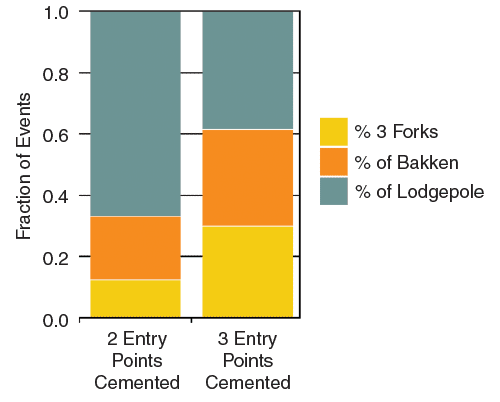
FIGURE 6
Phase One Vertical Containment Of Microseismic Events
By Entry Point
Tracer was pumped to gain insight into well-to-well proppant communication, and also provided information on propped half-length. Five double-volume stages with two entry points were traced, and all five stages were interpreted to have well-to-well proppant communication, whereas most single-volume stages were interpreted not to have communication. This information supported the GOHFER model half-lengths for stages with double volume and two entry points. This information reinforced that job size and number of entry points could not be looked at independently.
The next step in completion optimization was looking at the number of entry points per stage and the number of perf shots per entry point. The GOHFER model and the microseismic data provided insights into this component. Based on the two types of available entry points per stage for cemented laterals in phase one wells, microseismic data indicated that three entry points limited out-of-zone height growth better than two entry points. Figure 6 shows the percentage of microseismic events within the pay zone by entry point for cemented isolation.
The GOHFER model provided the most insight into the selected perforation scheme. After achieving matches on all 75 stages of the phase one wells, the calibrated GOHFER model was used to forward model different perforation schemes and treatment rates. The optimal combination was determined by the highest PFLA per lateral foot, which normalized the effect of lateral length.
Because of stress shadowing between entry points, more than three entry points in a 385-foot stage was not possible (WPX Energy is in the process of field testing more entry points within a stage). The analysis showed that the optimal combination for maximizing PFLA per lateral foot is 15 effective perf shots over three entry points at a treatment rate of 30 barrels a minute. The effective perf number comes from a an approximately 60 percent ratio of effective perfs to total perfs from the FPHMs, as well as from step-down analyses that have been conducted on all wells.
Treatment Rate
FIGURE 7
Optimal Perforation Scheme and Treatment Rate
From Cumulative PFLA per Lateral Foot
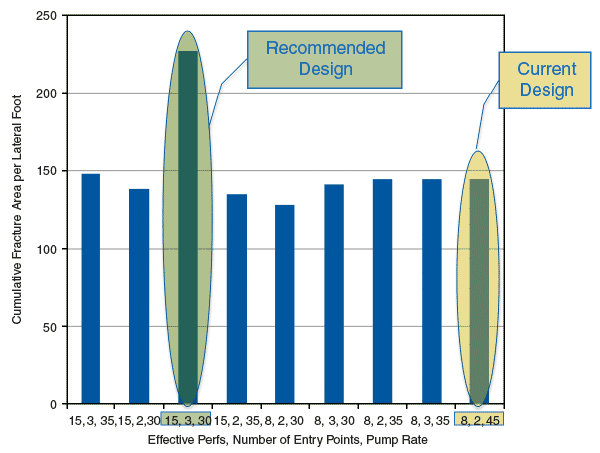
From the FPHMs, a correlation was evident between treatment rate and out-of-zone height growth, with distinct trends between less height growth and lower rate stages, and more height growth and higher rate stages (out-of-zone height growth has the potential to be detrimental to well performance by potentially increasing water-to-oil ratios, decreasing effective half-lengths, and decreasing in-zone conductivity). Figure 7 shows the chosen rate of 30 bbl/minute to maximize PFLA per lateral foot from the calibrated forward GOHFER model.
Treatment rate was included in the multivariate analysis, but it had a low sensitivity compared with stage length and proppant volume variables. The transformed treatment rate trend had a negative monotonic trend, showing that an increased rate would have a negative effect on the response variable. The transformed trend also showed no benefit from decreasing the treatment rate below 35 bbl/minute. The multivariate analysis supports the frac rate determined from the forward frac modeling.
Knowing what type of completion to pump, and understanding where to apply the design, will always be a concern. However, the results of the field trial demonstrate that the methodology is a cost-effective solution to this complex problem in Bakken/Three Forks wells.
Editor’s Note: The preceding article is the first in a two-part series on optimizing completion design in the Bakken/Three Forks play. Part II presents the recommended design and field testing results, and will be featured in the January 2015 issue of AOGR.
JESSICA BARHAUG is a senior completions engineer at WPX Energy, specializing in hydraulic fracturing design and evaluation, completions, rate transient analysis, and geomechanics. Before joining WPX in 2011, she was a production stimulation engineer with Schlumberger Data & Consulting Services, specializing in tight gas and shale formations. Barhaug holds a B.S. in engineering with an environmental specialty, and an M.S. in petroleum engineering, from the Colorado School of Mines.
VICTORIA MARTINEZ KING is the completions engineering team lead for the Williston Basin at WPX Energy. She joined the company in 2008 as a completions engineer in the Piceance Basin, before being promoted to completions engineer in the Williston. Martinez previously served as a petroleum engineer with Energy Corporation of America in the Appalachian Basin. She holds a B.S. in petroleum engineering from the Colorado School of Mines.
ANDREW SCHMIDT is a senior completions engineer at WPX Energy, designing and optimizing completion processes and methods for Bakken wells. Before joining WPX Energy in 2010, he served for seven years in completion procedures at Schlumberger, including as senior completions engineer, production stimulation engineer, product development engineer, and a hydraulic fracturing field engineer. Schmidt holds a B.S. in chemistry from Bethel University and a Ph.D. in chemistry from the University of Minnesota-Twin Cities.
Angie Southcott is geology team lead and senior geoscientist at WPX Energy in the Williston Basin. Before joining the company in 2011, she was a senior geoscientist at Rosetta Resources, a staff geophysicist at Oxy, and a geophysicist at Resource Solutions. Southcott holds a B.S. in geophysical engineering from the Colorado School of Mines.
LEE STEINKE is geology manager, Williston Basin, for WPX Energy. Before joining the company in 2011, she was at Williams for six years, where she was geology manager for the Powder River Basin and a senior geoscientist in the Piceance Basin. She began her career at Texaco as a geoscientist. Steinke holds a B.A. in geology and classics from the University of North Carolina at Chapel Hill, an M.S. in geology and geophysics from Yale University, and an M.B.A. from The Wharton School at the University of Pennsylvania.
HAROLD "HAL" HARPER has 34 years of experience as a geophysicist and geoscientist working in basins and settings around the world, including the Norwegian Sea, North Africa, Gulf Coast, Permian Basin, Mid-Continent, and all Rocky Mountain basins. He has worked at Professional Geophysics Inc., Conoco, Tom Brown Inc., Encana, Pioneer Natural Resources, Williams and WPX Energy. Harper holds a B.S. in geophysical engineering from the Colorado School of Mines.
For other great articles about exploration, drilling, completions and production, subscribe to The American Oil & Gas Reporter and bookmark www.aogr.com.

