


Hydraulic Fracturing Trends
Data Illustrates Evolution Of Fracturing Designs In Resource Plays
By Leen Weijers, Kevin Fisher and Paul Weddle
DENVER–Even as horizontal well development techniques continue to evolve in U.S. resource plays, many key questions remain unanswered regarding wellbore spacing, parent/child well interactions, “right-sizing” of proppant and fluid volumes during hydraulic fracturing, optimal lateral lengths, frac staging and perforation strategies.
The jury is not fully in agreement on the optimal answers, although the use of real data and multivariate analyses has provided many clues as to the direction these processes should take for maximum efficiency. However, much data mining still is needed to converge on the best techniques in shale and ultratight oil and gas reservoirs. Because of differences in how production is reported, Texas is a state where data sharing among operators would be especially useful.
Hydraulic fracturing treatments have evolved from simple, small treatments with minimal chemistry and low proppant volumes to extremely complex viscous fluids with high proppant concentrations, but still relatively low volumes in vertical wells, to today’s super-sized treatments that often use in excess of 20 million pounds of sand and 10 million gallons or more of water in a single horizontal well.
Because of the logistics involved in delivering sand, fluid and chemicals in a modern well, some of the real data analytics, modeling and engineering work that was performed routinely in the past now is being omitted in favor of more efficiently delivering the desired treatment plan. It may be worth reopening the case for data analysis (including determining which data is most pertinent) in order to converge on the optimal range of treatment parameters in a given field or reservoir within a horizontal resource play.
Perforation strategies are focusing on extreme limited-entry techniques with fewer perforations, but more clusters, to obtain more effective frac initiation points. With chemical additives, it appears the industry is “going back to the start” with minimal additives at low concentrations across the board. Proppant is heading toward the cheapest option, focusing on “just good enough” for created-fracture conductivity.
Statistical Tools
The amount and types of data available today in both public and private oil and gas industry databases is significant, yet it still is nowhere near the intensity of, say, U.S. credit card transactions over the lunch hour on any given weekday. From publicly available state-by-state production data to industrywide databases such as FracFocus and custom databases created by individual operating, service and consulting companies, the amount and richness of data to mine is impressive.
Access to public drilling and completion information has unleashed big-data multivariate analysis as a scoping tool that may be used to optimize production or to minimize the cost to produce a barrel of oil or oil equivalent.
These statistical tools have helped the industry on its path to higher well production and more economic wells by making changes over time in hydraulic fracturing designs that are effectively creating larger and denser plumbing systems in low-permeability rock. Massive fracture diagnostic projects also have helped close the loop on calibrated fracture growth and reservoir modeling. Each region has its unique set of optimum parameters, but several general trends hold across all resource plays.
FIGURE 1
Lateral Lengths, Stage Counts, Proppant
And Fluid Volumes, and Frac Rate by Play
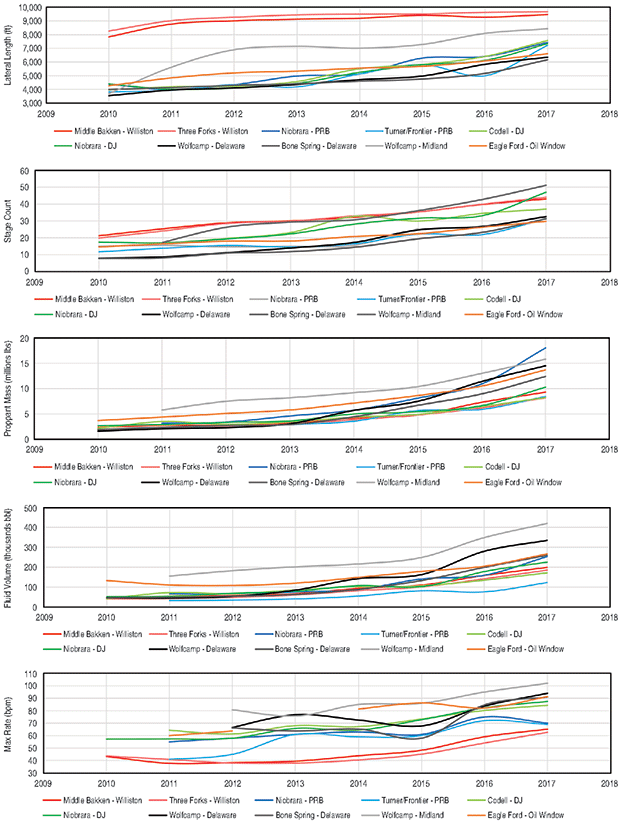
Figure 1 is a compilation of public data from several industry sources for the Williston, Powder River, Denver-Julesburg, Delaware, Midland and Eagle Ford basins. It illustrates the changes in lateral length, stage count, proppant and fluid volumes, and frac rates by play since 2010.
The technology focus in fracture treatments in U.S. shale plays has been on generating ever-larger and ever-denser frac fairways through several gradual completion changes, much like the original goals for Barnett Shale fracs at the dawn of America’s shale revolution 20 years ago. In order to create larger fracture networks:
- Companies are drilling longer laterals that access more rock and hydrocarbons at a lower incremental cost. The industry continues to strive to drill longer wells where possible since shale well economics align with a smaller footprint.
- They are increasing proppant mass and fluid volumes. Between 2010 and 2017, fluid volumes increased from 13 to 33 barrels per lateral foot while average proppant mass increased from about 500 to more than 1,600 pounds/foot.
- Companies are using fewer chemical additives and are reducing additive volumes. They are moving to friction-reducing slickwater, and more recently, to high-viscosity friction reducers. In addition, there has been a general change to cheaper and lower-quality, locally sourced sands. Overall, the industry is using fewer chemical additives and smaller additive volumes to place a pound of sand in formation.
Denser fracture distribution is related to:
- Stage counts are higher and stage intensity is increasing. The average stage count in resource plays has increased to about 40 a well, partially as a result of longer laterals, but also because of higher stage intensity. Average stage spacing was about 350 feet a stage in 2010 and was reduced to about 200 feet/stage in 2017.
- Pump rates per lateral foot increased from 0.16 to 0.42 barrels a minute/foot from 2010 through 2017 to improve diversion along the lateral. This change also has caused frac fleet sizes–measured in horsepower–to increase rapidly.
- Perforation strategies have changed toward extreme limited-entry with fewer perforations and more clusters/fracture initiation locations per stage for better overall fracture distribution. Operators also are grouping perforation clusters along the lateral in similar type rock (enabled by measurement-while-drilling data) to create more equal fracture growth from each perforation cluster and “leave no rock behind.” The industry has developed a range of chemical additives and particulate diverters to temporarily block flow into subsets of stage clusters, aiming to achieve a more equivalent distribution of fractures and surface area complexity.
Seeking Scale In Shale
FIGURE 2
North American Proppant Consumption (billions of pounds)
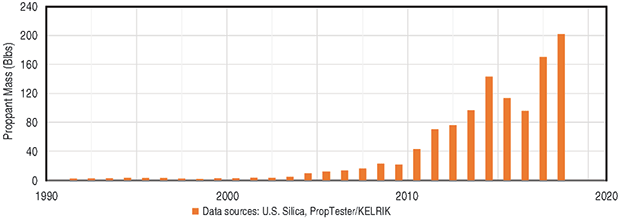
As illustrated in Figure 2, the industry has seen explosive growth in proppant usage per well, which is related directly to the overall growth in the amount of proppant supplied to the North American hydraulic fracturing market. In 2012, roughly 76 billion pounds of proppant (frac sand, resin-coated sand and ceramics) were supplied to North America. In 2018, the proppant industry set a record of more than 200 billion pounds.
But even as proppant quantity has increased dramatically, proppant quality has deteriorated, driven by what might be described as “just good enough economics.” The use of higher-quality proppants such as resin-coated sands and ceramics has been marginalized, and companies now are focusing on even lower-cost, poorer-quality sands sourced in close proximity to well sites.
In general, larger proppant volumes more than make up for poorer proppant quality in the production response of horizontal shale wells. A typical horizontal well has hundreds of fractures reaching into the wellbore, meaning that each frac carries an even smaller proportion of the total hydrocarbon flow. This dramatically lowers the need for fracture conductivity.
Also, the industry is beginning to indicate a preference for smaller proppants, first shifting to 40/70 mesh, and more recently to 100+ mesh proppants. This change is tied to the preference for low-cost, locally-sourced sands.
FIGURE 3
Use of Slickwater versus Guar-Based Gel Frac Fluid Systems
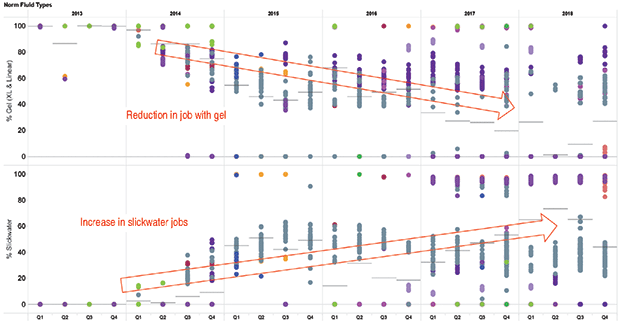
Companies are striving constantly to find better chemical products and to pump fewer of them. That is not only because we are good people, but also because it is good business. For example, the graphs in Figure 3 demonstrate how slickwater fluid systems, which use fewer chemicals and less of them, gradually are displacing more conventional and expensive guar-based gels that contain more products. This is an industrywide trend through the shale revolution.
Limited-Entry Perforating
The driving force behind “limited entry” is increasing perforation friction by artificially elevating bottom-hole wellbore pressures above any pressure differentials in the behind-pipe fractures. In a frac job, this can be achieved through pumping at a higher rate, pumping through smaller perforations, and pumping through fewer perforations.
Creating fracture complexity and a denser fracture system is a balancing act. It may be best to maximize a shale well’s production early by creating a fracture every few feet along the well’s lateral section. However, the maximum achievable pump rate often is limited in a frac job by the blender or by the associated maximum pressure at the wellhead.
This may limit the maximum rate to, say, 80-110 barrels a minute, which in turn limits the total number of perforations to which fluid and proppant are delivered. If one attempts to pump into too many perforations, some may not be stimulated effectively.
Various studies where wellbore fracture diagnostics were deployed by, among others, ConocoPhillips, Devon Energy, Liberty Resources, Schlumberger and Shell show that perforation cluster effectiveness (i.e., the number of clusters being stimulated during a frac job) was often not much better than 50%-70%.
FIGURE 4
Evolution of Limited-Entry Perforation Strategy in Liquids-Rich Basin
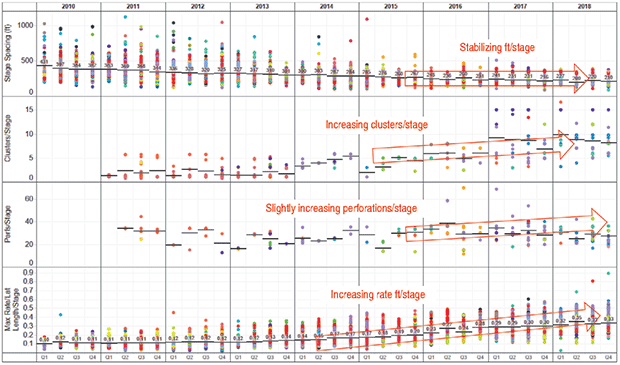
This has driven operators to find ways to improve perf cluster effectiveness in liquids-rich shale basins while also changing their strategies in order to maximize fracture density using more clusters. The graphs in Figure 4 show how these attempts have changed limited-entry strategy parameters in one such liquids-rich basin.
Of primary interest are the rate per perforation, the number of perforations and the number of perforation clusters. However, as most of the data is not available in the public domain, we must settle for rate per foot per stage, a proxy for the hydraulic fracture density created along the lateral.
As the graphs show, rate per foot per stage is up significantly, requiring service companies to bring ever-more horsepower to location. After a long period of reducing stage intervals in lateral feet, stage intensity appears to be stagnating in these basins at about 200 feet/stage. Some operators now are increasing their feet per stage while using a more aggressive limited-entry strategy as a way to reduce cost by pumping fewer stages while keeping proppant and fluid intensity per lateral foot unchanged. Operators also are exploring more efficient ways to treat these intervals by increasing cluster count per stage and rate while keeping the number of perforations about the same.
Limited-entry perforating, when done properly, can save in stage counts and lower well cost while creating a denser fracture network. While service companies have provided volume discounts on larger proppant volumes, they also have reduced their charges per hydraulic horsepower-hour, making up for this reduction by pumping more hours every day.
Limited-entry continues to lower operators’ cost per boe and continues to spread the wealth in the form of more prolific oil and gas production. This ultimately results in spreading the wealth to energy consumers around the world, who have saved more than a collective $1 trillion a year through shale revolution efficiencies since 2014.
Unruly Parent Wells
Many aspects of modern frac designs focus on creating a balanced distribution of fractures and placing an equal distribution of proppant within these fractures. Extreme limited-entry methodology is creating a more equal distribution of fractures along wellbores, creating higher-producing modern child wells than ever before.
One thing stands in the way of these productive children: bad behavior from their unruly parents. Their parents, back in 2008-12, often were completed with poor frac designs. That was not entirely their fault. Technology still had to come a long way to, for example, make plug-and-perf in cemented wellbores an effective technique in horizontal wells with measured depths of 15,000+ feet.
Among the worst behaviors were the “Hail Mary” frac (a single large fracture in a horizontal wellbore where it was hoped the pump-and-dump frac would stimulate a large portion of the lateral). In the extreme, a single fracture could have been created in a well, resulting in frac fluid and proppant intended for dozens of clusters all going in one place, possibly creating a fracture with a half-length in excess of 1,000 feet.
This bad parent behavior likely is responsible for the fact that operators sometimes see, for example, near-immediate frac hits during small-volume diagnostic fracture injection tests in child wells, which are observed almost instantly in wells hundreds of feet away. This is not caused by the child-well fracture, but by the extensive conductive flow path created in the parent.
In a 2015 infill-well-spacing pilot project in the Williston Basin, Liberty Resources documented some of these observations. In this case, the instantaneous shut-in pressures in a child well showed production depletion from fractures in a few parent wells, one of which was treated with a single Hail Mary-style frac and another with a six-stage, open-hole sliding sleeve completion (for information on the company’s Bakken completion strategy in the Williston, see ‘Extreme’ Perforating Strategy Key to Liberty Resources’ Bakken Completion Design, AOGR, September 2018).
FIGURE 5
Parent Well Shut-In Bottom-Hole Pressure
During Child Fracture Treatment
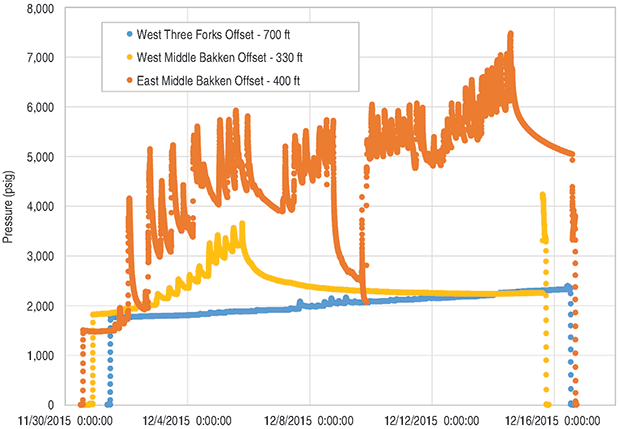
As shown in Figure 5, the Liberty Resources project observed three common offset-well bottom-hole pressure behaviors in parent wells from multistage fracture treatments in a child well:
- ≈1,000 psi frac hits during every stage (orange);
- ≈100 psi frac hits that stopped after about 10 stages as proppant from the parent well was pushed back into the liner and limited further communication with that well (yellow); and
- Minimal interference in an offset well one location over from the yellow well (blue).
The cost of cleaning up the yellow well can be on the order $400,000.
Therefore, operators have started opting to have pump-down services available on the offset pads of neighboring wells, which can attempt to push proppant back into the fracture system and immediately flush these wells. Also, operators have started to conduct prejob injections into offset parent wells in attempts to create a higher pressure “cage” around depleted parent wells.
As a result, as the industry is conducting more and closer infill drilling, it is focusing on ways to minimize the impact of interwell frac hits. One pressure pumping provider has started a new service that allows it to bring offset well pressures from different pads into the frac site data van in real time. This enables early observation of parent/child well interference, and helps customers decide on mitigation strategies on a parent well in order to avoid an expensive clean-out.
More detailed pressure interference analysis can help determine whether wells are stimulated effectively, whether a “frac protect” or refrac treatment with surfactants and other production chemistry is an appropriate way to minimize interference, and whether the created-fracture systems in child wells can avoid depleted pressure areas from parent well completions.
The hydraulic fracturing industry has changed beyond recognition, growing 10-fold in horsepower in the past 15 years, 20-fold in yearly stages pumped, and 40-fold in annual proppant mass pumped. Technological changes have resulted in a massive cost reduction to commercially produce a barrel of oil.
“Big picture” statistical analysis supports these frac design changes, showing the benefits of the industry’s move to larger volumes, higher stage intensity, and cheaper and lower-quality proppant.

LEEN WEIJERS is vice president of engineering at Liberty Oilfield Services, where he focuses on delivering improved well economics through optimized frac designs, and on data sharing and reporting to improve business efficiencies. Before joining Liberty in 2011, Weijers spent 16 years at Pinnacle Technologies, where he was Rocky Mountain regional manager and oversaw development of the industry’s most widely used fracture growth simulator. He played a key role in calibrating fracture growth models with various fracture diagnostics such as tiltmeter and microseismic fracture mapping technologies. Weijers holds an M.S. in geophysics and a Ph.D. in petroleum engineering from Delft University of Technology.

KEVIN FISHER is president and chief executive officer of PropX, a company dedicated to improving last-mile proppant logistics. Before joining the company in 2016, he served as president of Liberty Oilfield Services and as executive vice president of business development at Flotek Industries. Fisher began his career in 1979 with Halliburton, serving as a logging engineer, field supervisor, log analyst, sales manager and global technical marketing manager. He joined ProTechnics in 1993 as director of sales and marketing, and then moved to Pinnacle in 2000, ultimately serving as chief executive officer. He has a B.S. in natural science and physics from Cameron University.

PAUL WEDDLE is completions manager for Liberty Resources II LLC, a Denver-based independent with operations in the Williston Basin’s Bakken Shale play. He graduated in 2005 from the University of Texas at Austin with a B.S in petroleum engineering, and began his career working for Shell as a completion engineer, fracturing tight gas formations in Wyoming. Since then, Weddle has completed vertical and horizontal wells in unconventional oil and gas reservoirs in Utah, North Dakota, Texas and Oklahoma. He is a committee member for both the Society of Petroleum Engineers Hydraulic Fracturing Technical Conference and the Well Completions for Unconventional Resource Development Workshop.
For other great articles about exploration, drilling, completions and production, subscribe to The American Oil & Gas Reporter and bookmark www.aogr.com.