


Digital Twin Algorithm Predicts Well Drilling Time Using Historical, Real-Time Data
By Gurtej S. Saini, Pradeepkumar Ashok, Eric Van Oort, and Matthew R. Isbell
AUSTIN, TX.–Advancements in sensor technology, computational power, data storage and analytics are driving the adoption of the “digital twin” concept in a variety of oil and gas applications, ranging from condition-based maintenance of equipment such as top drives and artificial lift systems to predicting stuck pipe issues and bit wear.
One novel application of digital twin technology has come in predicting time to total depth in horizontal drilling operations. Drilling is a mission-critical operation. Process and equipment failures result in nonproductive time that can add several hundred thousand dollars to drilling projects in unconventional reservoirs. Drilling also is unpredictable, given the inherent irreducible complexity of dealing with varying geological formations.
The ability to accurately predict time to TD with a digital twin is of considerable value for improving the certainty of a well’s drilling schedule, and consequently, the overall timing of the drilling and field development program. Digital twins also can help predict, and thereby prevent, failures, which reduces the likelihood of NPT events.
In addition to reducing well construction time and unnecessary cost, digital twins can enhance the logistics of scheduling rig moves, well services, subsequent completion operations and other activities to minimize standby time and delays resulting from waiting for services or equipment to arrive.
Well construction is conducted as a sequence of tasks, and lots of data are collected during these sequential activities. By leveraging the repetitive nature of the drilling process, predictive data-based models can be developed that serve as a good starting point for initial time-to-TD estimates. They can be enhanced further by using advanced physics-based models for hole cleaning, torque and drag, bit degradation, etc. These models can be applied to make predictions about any individual well delivery activity, including time to TD.
A new approach developed by researchers in the Rig Automation & Performance Improvement in Drilling (RAPID) consortium at the University of Texas at Austin uses physics-based models with historical data from offset wells in conjunction with real-time data acquired while drilling new wells to predict time to TD and improve drilling performance. Like navigational aids for vehicles, which not only provide initial estimates of the time required to reach a destination based on routing options, but also update those estimates in real time to account for ever-changing outside circumstances, the digital drilling twin aims to provide accurate and continuously updated predictions of time to TD.
The concept was tested successfully using data from a four-well pad in the Bakken Shale play. Three of the wells were used as a historical data reference, and the digital twin algorithm was run on the fourth well for validation.
Digital Twin Solution
The three main parts of any digital twin are the physical system, the virtual model that describes the physical system, and the exchange of data and information between the two. Real-time data and physics-based models are integrated with historical data to virtually mirror the behavior of a physical system or asset and provide real-time recommendations about a future course of action.
Accordingly, a digital twin is a virtual physics and data-based model that encompasses all the various subsystems, their properties, interactions among them, and interactions of the system with the environment. One key property of a digital twin is that the various subsystem models are updated throughout the life cycle of the asset, and with real-time data, a digital twin is able to predict future events.
The well construction digital twin solution uses data-derived models from historical data and real-time data collected while drilling to make time-to-TD predictions. Before drilling starts, an initial estimate of time to section depth is made using historical data (data-based models). As drilling gets under way, the initial prediction is updated continually as new data are acquired using a dynamic weighting scheme for the data points collected at different times. The time-based predictions generated by a digital twin can help plan and optimize the logistics on a rig.
The goal is to anticipate future events and estimate the times for individual activities at every point in the well delivery process. Time to TD depends primarily on two factors:
- Performance while drilling, which is quantified primarily by rate of penetration; and
- Performance while not drilling, which is quantified by the time spent on tasks such as tripping, circulation, making connections, etc.
ROP depends on downhole rock formations, hole and bit condition, and drilling parameters, and can be predicted with a physics-based model in combination with data from offset wells.
When viewed from the perspective of rig activities, the total time to TD consists of the time spent on on-bottom drilling, obtaining all surveys, making up all connections, tripping in and out of the hole (including making up and laying down the bottom-hole assembly), circulation, and performing miscellaneous tasks (all other operations). The digital twin algorithm uses offset well data to derive initial values for each of these activities, and uses real-time data to predict time to TD based on factors such as total footage, number and depth of formations, and average ROP for each formation.
Two-Step Process
The first step is applying a rig-state-detection algorithm on offset well data to identify the different rig states for all wells in the dataset, including connections, surveys, on-bottom slide drilling, on-bottom rotary drilling, circulation, and tripping in/out of the hole. Descriptive statistical analysis then is performed on the classified rig states to identify the mean, best- and worst-case times for the various rig states for all wells. Metrics such as average time to make connections, the fastest and slowest connection times, stand lengths, etc., are estimated over the entire offset well dataset.
Similarly, on-bottom drilling is classified as either slide or rotary drilling, along with the corresponding depths drilled and mean ROP. The analysis is performed on a formation-by-formation basis for increased accuracy. Some of the resulting average values that are obtained from analyzing the offset well data are:
- Average slide drilling ROP;
- Average rotary drilling ROP;
- Percentage of depth that was drilled by slide and rotary drilling;
- Average connection time;
- Average time for surveys;
- Average tripping time per foot;
- Average circulation time per foot; and
- Average miscellaneous time per foot.
Before drilling starts, the offset well-based estimates, along with the information about the planned start depth, total depth and expected formation tops, are used to initialize the prediction algorithm and give a time to TD based on the offset well data.
Once drilling starts, the second step is integrating the real-time data stream into a prediction algorithm to predict rig states as new data are obtained. Summary statistics for the offset well data continue to be created, but the workflow now also includes an adaptive weighting scheme using real-time statistics, with more weight given to real-time statistics than offset well data.
The algorithm considers a percentage of points in each rig state from the current time, such as until time t2, and assigns these points the highest weight (W1). Then, another predefined percentage of points is considered before time t2 until time t1 and assigned a lesser weight of W2. Similarly, all points in time from t0 to t1 are assigned a weight of W3. Finally, historical data are assigned the lowest weight of W4. The sum of the weights equals 1. The t1 and t2 times for selecting the points are not fixed, and their values depend on the total number of data points collected at the current time instant.
One of the main states is the drilling time, which is calculated utilizing an equation that includes factors such as total depth (combination of individual depths to be drilled by slide and rotary modes based on the well plan), and formation-specific drilling data from offset wells. The final predicted time to TD at any given point is estimated by the sum of the predicted times spent in each of the various rig states.
Bakken Test Application
The proposed algorithm was tested on data from a four-well Bakken pad that consisted of one-second surface and downhole sensor data, formation top information, the well plan, and BHA/bit run summaries from daily morning reports. For these wells, the time to TD prediction algorithm was implemented on the horizontal sections, all of which were drilled in the same formation. Three of the wells were selected as offsets and historical data from the wells were used to make initial predictions. Descriptive statistical analysis was performed to formulate the initial conditions for running the prediction routine.
FIGURE 1
Summary of Time-to-TD Prediction Process
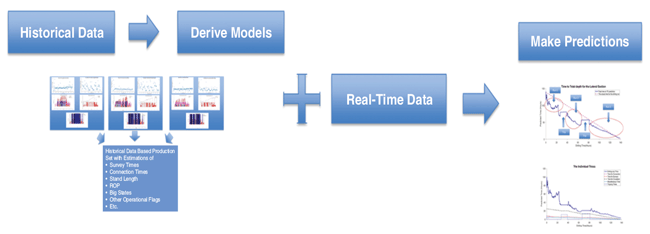
The fourth well then was simulated as a real-time well, and the data at every time step (one second per data point) were plugged into the algorithm in one iteration of the conditional loop. Figure 1 demonstrates the process by which data-driven models for initialization were built using the data from the three offset wells, and then predictions of the time to TD were made based on continuously updated real-time data from the fourth well.
The rig-state-detection algorithm run on data from the three historical wells used basic “channels” typically available in any drilling dataset, such as hook load, block height, RPM, ROP, surface torque, etc. Then, using the determined rig states and certain predetermined data channels, statistical estimations were made about the time spent in the different states.
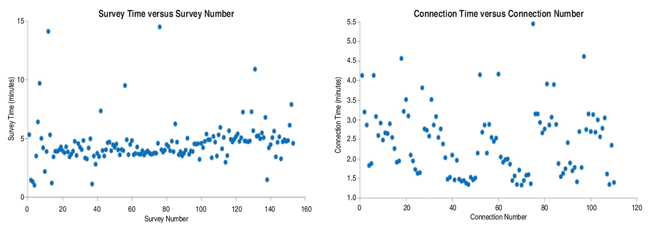
Figure 2 shows a scatter plot of all the survey and connection times in one of the offset wells. Based on the times in each state, the mean, maximum and minimum times were estimated for all wells.
FIGURE 2
Connection and Survey Time Scatter Plots for Offset Well
The next step was initializing the algorithm with the time estimates and planned TD. To begin implementing the algorithm, the only additional information required was the starting and ending depths of the section, and the historical data-based statistics.
After initialization, the real-time data for the fourth well were used to make predictions. Based on these data channels, rig states were identified and the next steps were performed to estimate the individual times for the different well delivery tasks: on-bottom drilling, tripping, making/breaking connections, etc. The total time to TD at any point then was calculated as the sum of the times predicted for the individual well delivery tasks.
Figure 3A shows the times that were estimated to make the predictions. Figure 3B illustrates the final plots generated for the time-to-TD predictions.
FIGURE 3A
Individual Times for Different Rig States (Entire Lateral Section)
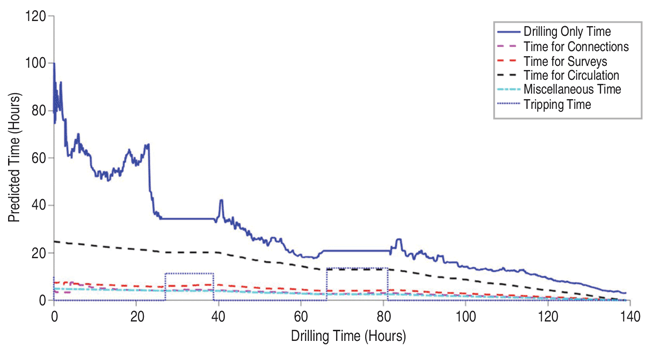
FIGURE 3B
Predicted Time to TD versus Actual Drilling Runs
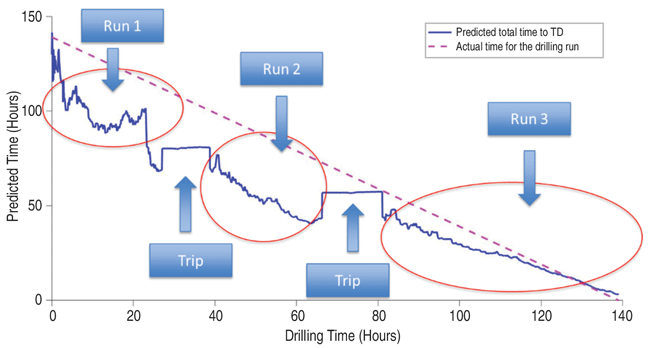
The total time at any point is the sum of the predicted times for the individual well delivery tasks at that point. The figure shows three individual runs and two trips. The tripping time was projected, based on the tripping times per foot estimated from the historical data and the depth at which the trip was identified by the algorithm. Therefore, tripping times depend on the depth at which a tripping operation is initiated.
The figure also illustrates that the plot of the predicted time is not smooth. This is because of the different weights assigned to the data points collected at various times, and slide and rotary drilling considerations in making predictions.
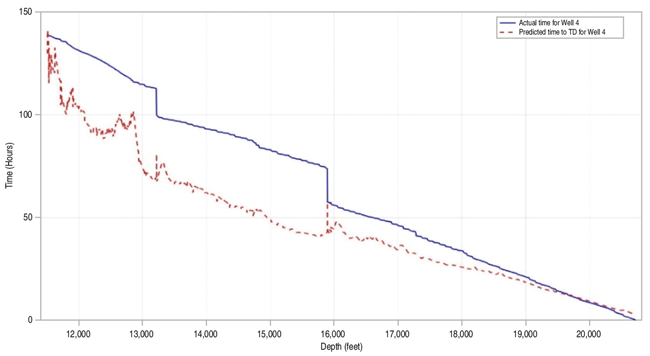
To evaluate the accuracy of the predictions, the predicted time to TD and actual times were plotted against the measured hole depth. Figure 4 shows the plot of the two times with respect to hole depth.
The initial predictions were consistently optimistic until after the final trip. The difference was reduced significantly beginning at a depth of ±19,500 feet, or about 1,000 feet from section TD, at which point the predictions started matching actual values. One reason for the optimistic prediction is that the algorithm initially assumes one run to the TD, and does not include unexpected tripping times.
FIGURE 4
Actual versus Predicted Time to TD for Fourth Well
As demonstrated using the Bakken well data, the drilling digital twin technology is enabling the first time-to-TD predictions made in real time using predictive data-based models. Ongoing development work seeks to expand on the algorithm’s capabilities by breaking the “miscellaneous” category into multiple subcategories to improve rig state identification, and by adding a degradation model to estimate the bit’s condition and impact on drilling efficiency and ROP over time.
The approach has many possible applications; budgeting and logistics are the most important among them. It can be used as a dynamic scheduling tool for an individual well or it may be extended to a multiwell program. The new insights and clarity this kind of digital twin solution brings to drilling operations will be crucial to minimizing NPT, reducing costs, optimizing drilling performance and improving the overall well construction process.
GURTEJ S. SAINI is pursuing a Ph.D. in petroleum engineering at the University of Texas at Austin. His research focuses on applying the concepts of digital twinning to drilling. In addition, he is working on the Rig Automation & Performance Improvement in Drilling (RAPID) group’s data analysis project. Before beginning doctoral studies, Saini worked at Schlumberger. He holds a B.S. in electrical engineering from the Birla Institute of Technology & Science, Goa, and an M.S. in electrical engineering from the University of Texas at Austin.
PRADEEPKUMAR ASHOK is a senior research scientist in the RAPID Group at the University of Texas at Austin, and directs the university’s drilling data analytics student program. He also is the chief technology officer of a startup company, Intellicess, which was spun out to commercialize a technology that differentiates between sensor and process faults. Previously, Ashok was the program manager and chief scientist of the University of Texas’ robotics research group, where he managed automation projects. He holds a Ph.D. in mechanical engineering.
ERIC VAN OORT holds the B.J. Lancaster Professorship in Petroleum Engineering at the University of Texas at Austin. He directs drilling and completion research and development in the RAPID and CODA consortia, which includes drilling automation, data analytics, cementing and zonal isolation, abandonment and decommissioning, drilling/completion/frac fluids, and drilling-related geomechanics. Van Oort joined the university in 2012 after a 20-year career with Shell Oil Company. He holds 14 patents and has 11 patent applications in progress. He is a former Society of Petroleum Engineers distinguished lecturer, an SPE distinguished member, and the 2017 winner of the SPE Drilling Engineering Award. Van Oort holds a Ph.D. in chemical physics from the University of Amsterdam.
MATTHEW R. ISBELL is drilling optimization adviser at Hess Corporation, where he is focused on improving drilling performance and delivering efficient system solutions in unconventional resource plays. Isbell has nearly three decades of global experience in drilling engineering, and has held a number of drilling technology roles in research and development, field engineering, marketing and management. He holds 26 U.S. patents related to drill bit design. Isbell has a B.S. in mechanical engineering from the University of Texas at Austin.
For other great articles about exploration, drilling, completions and production, subscribe to The American Oil & Gas Reporter and bookmark www.aogr.com.