


Reservoir Characterization
Technologies Redefining Interpretation
By Eldad Weiss
HOUSTON–The seismic data analysis process has its roots in the 1980s, when computing limitations created a funnel-like data decimation process in which megabytes of original seismic prestack data eventually were whittled down to a few hundred kilobytes of stacked data. Paper interpretation was performed using the stacked data, meaning that interpreters were, by definition, working with incomplete and possibly misleading data. Similarly, conventional application software mostly mimicked traditional paper-and-pencil working methods by “computerizing” them without essentially changing the way interpreters worked.
Today, both data acquisition and data access capabilities have increased exponentially, and interpreters now have full access to all the seismic data all the way through the data analysis process. Where the geoscientist once only had data from the previous stage to work with, he now has full access to enormous amounts of data and multiple data sets measured throughout the field’s life cycle. He has the ability to refer to the data as needed at any point to substantiate the interpretation and to add further clarity to the results.
Yet in many ways, interpreters continue to use the same conventional techniques and methods that were practiced for years. That includes continuing to mechanically pick horizons out of decimated data sets, even though this kind of manual interpretation work is no longer necessary and fails to take advantage of new technology. The conventional approach to interpretation must evolve to match the full potential of available data.
During the late Middle Ages, a “renaissance man” was considered to be someone who had read every book in print. Since a very limited number of books had been printed prior to the development of movable type by Johan Gutenberg in 1445, this was a pretty manageable task. Today’s renaissance man would need a lot of help to read every book in publication. Similarly, the amount of seismic data available today has long passed the point where one person can handle them all.
And not to be forgotten, the younger generation of geoscientists has grown up in a computerized world. Computer graphics, computer games and the latest gadgets from Apple are the defining characteristics of this generation’s renaissance men. They spend many of their waking hours on the Internet; they are comfortable gathering, comparing and analyzing data from multiple sources; and they know how to get the most out of their computers. These young geoscientists, engineers and programmers will be satisfied with nothing less than the most advanced automation tools and information integration systems for their work.
New World Of Capabilities
Ultrafast networks, very low data storage costs, and exponential improvements in computer power all have contributed to making it possible–both technically and economically–for a company to load an entire basin’s worth of data into its computers (at least one oil and gas company actually has done this). The huge increase in data size, resolution and fold are further augmented by the accessibility of many types of data–including seismic, wells, microseismic, 4-D seismic, well bore video and others–allowing a more holistic look at the regions, basins, formations and reservoirs under investigation.
In addition to data for the particular area of interest, the interpreter now is able to access all regional data, including project and vintage data from previous surveys. Manual data manipulation is not sufficient to handle such a huge amount and variety of information.
One might compare the situation in the industry today to the evolution of Internet searches. With the first search programs, a user seeking information was provided with huge chunks of data, which needed to be laboriously searched in order to find the specific area of interest. Today, search engines present all the data in a prioritized manner, and one need only choose the preferred information.
Similarly, the powerful automation tools developed over the years by oil and gas software companies are able to gather and analyze enormous amounts of seismic and other data, and present the user with a variety of scenarios describing the geological model of the subsurface. The interpreter need only verify which of the scenarios is or are the most geologically plausible, and assess the risk associated with each.
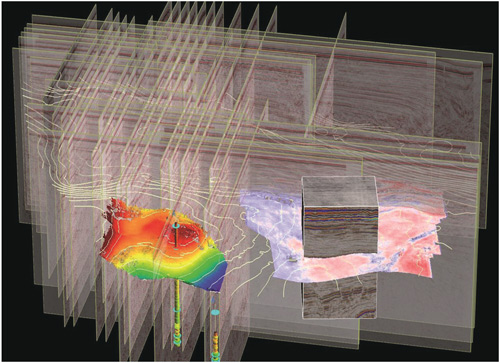
Until recently, all advanced interpretation work was done using a single-survey, single-volume approach. Interpreters would load a 3-D seismic data volume into their systems, and then work on those particular volumes. Today, technology enables interpreters to load multiple 3-D volumes from multiple surveys, and all the 2-D profile data as well, enhanced by many other data types available to the company within and around the area of interest (Figure 1). This provides them with new insights into the geology of the entire region, and leads to better and more informed decisions down the line.
FIGURE 1
Feature Correlation Between Transparent 2-D Lines and 3-D Surveys
Automated Tasks
The past few years have seen increased automation in every aspect of the interpretation process. Some of the most notable developments include the advent of waveform-based automatic horizon propagation, which has resulted in a major acceleration of the interpretation workflow because of its speed and accuracy. Automatic fault extraction techniques enable seismic interpreters to quickly pick hundreds of faults at a time, allowing them to concentrate on geologic history rather than on the tedious picking process. A powerful tool for interactive cross-plotting within a 3-D visualization environment is now commonly available for use, enabling advanced multiple-attribute interpretation.
Furthermore, automated switching between full resolution and decimated data sets enables the interpreter to switch back and forth between the regional, local and reservoir detail scales of a project at a click of the mouse.
Traditionally, prestack interpretation was done by experts using specialized software, such as amplitude variation with offset, velocity analysis, etc. Prestack interpretation was not traditionally part of mainstream data models. But while interpreting prestack data may be challenging to the interpreter working at the desktop, the information it offers is highly valuable. Prestack data provide dynamic and kinematic information, help validate interpretations, provide calibration to well data, and enable cross-plotting.
Prestack interpretation tools are becoming mature enough now for mainstream interpreters to use, but interpreters also will need to rethink their working methods in order to tackle this new challenge. To manage prestack data (loading, accessing and displaying data), and in order to locate a specific point in space, one needs to develop not only new data access and display capabilities, but also new ways to interpret the results.
Visualization And Storage
With so much data now available, and with massive data integration possible at the desktop level, interpreters are in danger of being overwhelmed. Indeed, one of the greatest challenges before the interpreter today is coming up with new visualization technologies and interpretation workflows to fully utilize the new data within tight project deadlines.
Visualization technologies have come a long way since the first 3-D voxels started appearing on computer screens 15 years ago, showing such novel concepts as transparency and sculpting. The evolution process has followed two consistent trends: The amounts of data being handled are increasing constantly, and the visualization process now includes numerous data types and the rendering of specific data objects.
Over the past few years, data storage technology has expanded to allow storing huge amounts of data on disks rather than in computer memory, making it possible to view data sets that are much larger than the computer’s physical memory. This is most relevant for the tens or hundreds of gigabytes of seismic data often required for a single survey. It has also opened the door to using 3-D display and interpretation tools within routine workflows.
Dramatic improvements in the performance of input/output devices, as well as in computer power and data handling, are enabling many capabilities once possible only from computer memory to become feasible on data residing mostly on disk. One of these is optical stacking, or the application of transparency capabilities to 2-D seismic surveys. This technique, which lets the user line up a succession of 2-D profiles and move the display around in three dimensions, eliminates the lengthy and tedious back-and-forth workflows sometimes needed to verify assumptions regarding a fault’s direction and development. This is particularly relevant to 2-D seismic profiles, where ambiguities are more frequent because of the nature and limitations of the data and of sections, as opposed to 3-D migrated volumes.
In terms of real change, however, the growth of interest in prestack seismic data has been putting pressure on visualization tools to help interpreters manipulate not only large amounts of data, but data objects that are not part of the post-stack X-Y time or X-Y depth coordinates system. The demand for visual access to the original data stems from the challenges of investigating very detailed features in the process of qualifying and characterizing the subsurface. And indeed, the ability to directly access and display prestack data is one of the new tools coming onto the market.
The emergence of prestack data as a component of many workflows requires more than simply an ability to see trace data. The inherent complexity of ray paths through the overburden, the sheer volume of data that need to be accessed, and the effects of anisotropy on waveform propagation are only some of the challenges that face deadline-constrained geoscientists who suddenly are being required to make sense of 30 to 50 times more data than before. Visualization tools, new display methods, and processes that make visible the illumination that resulted in a given reflector or event are all part of the answer, and will increasingly become accessible to the new generation of geoscientists.
Geological Control
Integrating a geological model into modern workflows is a major step toward increasing the reliability of exploration prospects. Geostatistical tools can help outline an initial distribution of formation properties, as well as preliminarily populate values in areas that lack any local calibration. The geoscientist can use this early information to guide initial interpretation efforts. Once interpretation takes shape, interpreters characteristically will adapt the horizon and fault picking process to their notions of what makes geological sense, based on their experience in the region and their knowledge of analogous geological settings.
Until recently, there was no straightforward way to verify that the outcome was coherent, other than by peer review. New, automated model-building technologies that use a rigorous description of the stratigraphic column to transform horizon and fault plane data into a full 3-D model enable objective verification of the interpreter’s assumptions made during the picking process. With the dramatic acceleration of the model-building process, uncertainty regarding a model’s accuracy can be estimated by generating many models with varying parameters, followed by the same processes as those used by reservoir engineers to assess the differences in the outcomes.
An exciting new technology that delivers enriched knowledge to the interpreter provides comprehensive 3-D solutions for visualizing and analyzing three-dimensional gathers; in particular, directional and reflection subsurface angle gathers, including seismic data and illumination/ray attributes. By combining prestack and post-stack data in a shared 3-D visualization canvas with integrated, interactive modeling tools such as ray tracing, it is now possible to visualize the connection between the multidimensional surface seismic acquisition geometry and the target subsurface area.
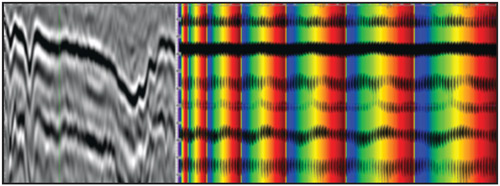
FIGURE 2
Directional Angle Gather Along a Pinch Out
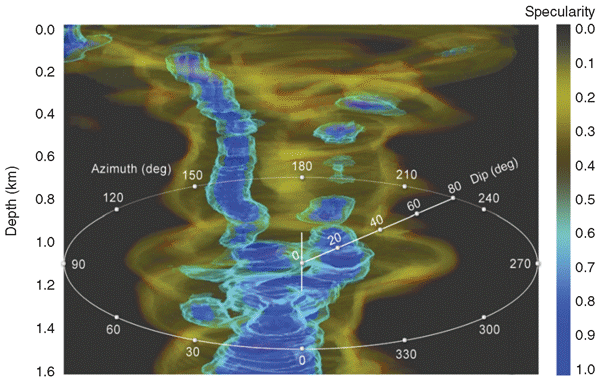
FIGURE 3
Identifying Fracture Orientation from Azimuthal Variations of Move-Outs
The information is displayed in a clear visual manner, adding detail and accuracy to the description of the subsurface to simplify even the most complex set of characteristics. This provides extensive information about the reliability of the subsurface image in both land and marine environments, and indicates which steps are to be taken in areas requiring improvement.
This technology has been applied successfully for velocity model determination and depth imaging in complex geological areas (Figure 2), as well as in unconventional shale regimes, to detect subsurface stress patterns and intensity, and to identify small fractures. Figure 3 shows a continuous full-azimuth reflection angle gather, unwrapped over the azimuth and opening angle. The azimuthal variation of the moveouts indicates the fracture orientation.
The new data images provide a novel way for interpreters to interact with seismic data and to characterize shale plays with increased confidence. For example, in the Mississippian Barnett Shale, the largest onshore field in North America, a combination of advanced visualization methods and accurate analysis tools helped reveal optimal areas for planning horizontal drilling.
The interpreter’s work always has involved a modicum of artistry. With the onset of the new technologies, one might say that to that artistry has been added adherence to rigorous engineering principles. While the interpreter’s creativity and intuition still are important parts of the job, the engineering principles enable one to look at the results and their statistical uncertainties, and use them to decide what risks may be present and where they are located when making drilling recommendations.
I am confident that in the years ahead, the industry will look back at the way geoscientists work today and acknowledge that what were once deemed rarified and resource-intensive technologies will, in the future, be performed by a new generation of geoscientists as a matter of routine.

ELDAD WEISS is the founder and chief executive officer of Paradigm Ltd. Under his leadership, Paradigm has grown from a small, boutique technology player into a full-solution organization serving all the major oil and gas producing provinces in the world through a global network of 26 offices in 22 countries. Weiss led Paradigm through 10 strategic acquisitions as well as several financing rounds. In 2002, he was awarded the Ernst & Young Entrepreneur of the Year Award for the high-tech segment. Weiss holds a bachelor’s and a master’s in electrical engineering.
For other great articles about exploration, drilling, completions and production, subscribe to The American Oil & Gas Reporter and bookmark www.aogr.com.