






Clearer Diagnostics And Careful Engineering Advance Completion Design
By Colter Cookson
Between 2010 and 2025, the amount of oil an average well in the Lower 48 produces in its first year has jumped from 60,000 barrels to 160,000.
And those barrels cost significantly less to access. In the 12 years between 2012 and 2024, the oil and gas industry reduced the average drilling and completion spend for each first-year barrel of oil from approximately $100 to $34.
These statistics comes from Everything = Energy, a newsletter hosted by Substack and authored by Leen Weijers of Liberty Energy. He says the industry can produce more with less largely because efficiency gains have allowed it to drill longer laterals and ramp up frac intensity.
“We’re basically creating larger frac extent and increased frac density through longer laterals, more stages, more clusters, pumping more proppant, pumping more fluid and at a higher rate, not just in a well, but also on a per-foot basis,” he observed in a video posted on July 8. “These changes have been achieved through efficiency gains and improvements in throughput.”
In a May 22 conversation with the PetroNerds Podcast, Weijers illustrated these efficiency gains with a striking visual. When Liberty Energy formed in 2011, it pumped about four railcars of proppant a year for every employee in the office or field. Today, each employee contributes the equivalent of about 50 railcars.
Noting how competitive the frac market is, Weijers says other skilled service companies have made similar strides. Pair that efficient execution with more effective frac designs, and the cost per barrel has fallen dramatically.
Today, frac designs continue to evolve rapidly thanks to a more robust toolbox for figuring out what is happening below the surface.
“Over the past decade, frac diagnostics have gotten much better,” says Mark McClure, co-founder and CEO of ResFrac. “That is partly from combining cross-well fiber, in-well fiber, and volume to first response (VFR) to understand where fractures grow, how fast they propagate, how many there are, and where they close. Also, pressure observation laterals have allowed us to directly measure the propped length and the proppant pack conductivity.”
Downhole imagers from companies such as DarkVision and EV have become some of the most widely used diagnostic tools, McClure adds. “They have a fairly low cost, and they’re really useful for imaging perforations and making sure plugs aren’t slipping,” he says.
One of the imagers’ primarily applications, he continues, involves estimating how much proppant enters each perforation by comparing the expected size of the hole to the actual size after the job. Proppant erodes perforations as it passes through them, so the larger they are, the more proppant they’re likely to have received. McClure says these perf-level insights have helped the industry refine techniques for achieving more even proppant distribution.
Collectively, modern diagnostics have given the industry a much clearer picture of what is happening in the subsurface than it had a decade ago. “The extra information has allowed companies to do a couple of things,” McClure says. “First, we’ve evolved to better frac designs in terms of higher density. Second, we have more ability to diagnose what’s happening on a case-by-case or play-by-play basis, which means we can tailor treatments more effectively.”
Designing for High-Stress Plays
In many plays, including the Utica, Marcellus, Eagle Ford, and SCOOP/STACK, wells sometimes perform below expectations because their fracture networks extend horizontally. At first, the fractures propagate vertically, as intended. But eventually, they encounter a high-stress layer that causes them to turn horizontal and create a flat plane.
“This sends the fluid and frac energy in a direction no one wants it to go,” McClure says. “The frac is designed to create vertical fractures that extend laterally and cover the pay zone. If they begin propagating horizontally instead, as if they were a pancake, they are no longer accessing additional pay.”
Even in the areas they can access, McClure says horizontal fractures tend to be less productive. The amount of oil that flows into a horizontal fracture is heavily influenced by the rock’s vertical permeability, which in many areas is lower than the horizontal permeability, he explains. It can also be more difficult to get proppant into horizontal fractures, so they close more quickly.
“A horizontal fracture can cause casing deformation or loss of a well,” McClure warns. “Near the heel of the well, those fractures could create strain, including bedding plane slip, that shears off casing in the heel.”
In wells where fractures seem likely to pancake, McClure recommends adjusting the design to minimize the risk. This usually means reducing the fluid volume, changing the injection timing and widening the cluster spacing.
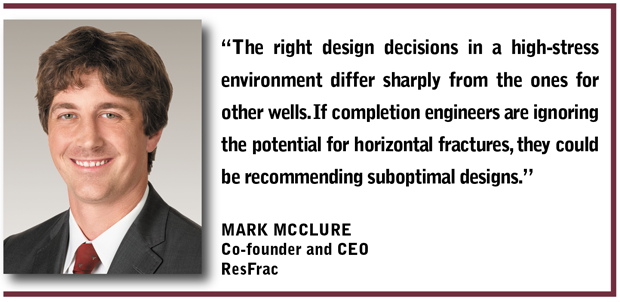
“The right design decisions in a high-stress environment differ sharply from the ones for other wells,” he says. “If completion engineers are ignoring the potential for horizontal fractures, they could be recommending suboptimal designs.”
Fortunately, McClure says the stress barriers that create horizontal fractures can be easy to spot. “If the instantaneous shut-in pressure is consistently around the overburden stress, that’s a big clue they’re present,” he says.
Iteration
Whether they are in in a high-stress or low-stress play, McClure encourages completion teams to constantly test new ideas. “Every single year that I’ve been involved in the oil and gas industry, I’ve met people who believed they had most things figured out and no longer needed to try much new stuff. And then every single year, new stuff comes out that makes completions more effective or efficient.”
In many cases, those novel ideas can be evaluated with almost no risk beyond the extra cost associated with a small-scale field trial. That cost matters, but it pales in comparison to the potential gains if the initial trial and subsequent expansions go well enough that an operator eventually applies the technology to hundreds of wells, McClure reflects.
Today, McClure says one common area for experimentation relates to surfactants that can be deployed as part of enhanced oil recovery projects or included in completion fluids to improve production from new wells. For example, Chevron has developed a surfactant blend that it has applied to 600 wells in the Permian, including ones that were recently completed.
“We’ve seen up to 20% improvement in early-time productivity in our new wells, and we’ve stemmed the decline of base wells by 5% to 8%, so we’re extending the runway of our assets,” Birlie Bourgeois, the director of applied technology for Chevron’s unconventional business, told attendees at the Unconventional Resource Technology Conference in June, according to a report in the Journal of Petroleum Technology.
Chevron is far from the only operator touting surfactants. In early September, Primary Vision reported that executives have talked about surfactants on earning calls more times this year than in the past two decades combined. “None of this means surfactants are showing up on every well tomorrow,” the analyst writes. “Operators like Diamondback and Permian Resources are still calling their results promising but early.”
McClure has a similar assessment. “These surfactant and chemical concepts may not be a slam dunk yet, but they’re promising,” he says. “If operators can hit the right formulation for where they are, they could get a high ROI for a low cost.”
Running Useful Tests
When they’re evaluating new chemistries or tinkering with completion designs, McClure encourages operators to design trials carefully. “Sometimes we see companies change several variables at the same time, which makes it difficult to figure out causes and effects,” he says.
Instead, McClure suggests selecting several otherwise similar wells, making a change in some, and comparing the results. While variation will still occur from well to well, it’s possible to draw reasonable conclusions from such trials.
Because of variance, the sample size in any test matters.
“With downhole imaging, for example, there will be a lot of random variance from stage to stage. If a company collects images on every stage in a 50-stage lateral and calculates the average, they will see some clear behavior. However, individual stages can look far different than the average.
“That can be a challenge for testing new designs,” he says. “For example, sometimes a company will run several different perf designs in the same well and then try to compare them. But if they only have five stages with each design, the differences may reflect variations rather than the actual performance.”
The Next Change
Realistic simulations can help operators understand why a given change led to specific results, then decide which adjustments to try next. Because full simulations take more time and resources to run, McClure often recommends using narrower tools designed to solve specific problems.
As an example, McClure says ResFrac has developed a proppant transportation simulator that can quickly predict where proppant will leave the wellbore with a given stage configuration and pump schedule. It doesn’t look at the resulting fracture geometry, but it can help completion engineers distribute proppant more evenly, which almost always leads to higher production.
McClure says the simulator is especially accurate when it can be calibrated using the perforation erosion data from downhole imagers.
“By turning a few knobs to account for local conditions, we enable the simulator to come up with extremely accurate predictions about what will happen downhole on a particular job. With that information, we can recommend a few changes to the perforation strategy that should improve uniformity,” McClure says. “These changes can be very cheap and practical to implement, but they often deliver meaningful production uplifts.”
After making the changes, many operators will run downhole imagers to verify that the new design delivered the expected results. While McClure says the answer is usually yes, he acknowledges that even a full-scale simulation will have blind spots that sophisticated ultrasound imagers can reveal.
“We try to integrate as much physics into our software as we can, but we would never claim it is omniscient or infallible,” he says. “However, it is precise enough to shorten the engineering learning curve. When engineers try something, it can help them evaluate what happened and let them run several scenarios to determine whether they’ve hit the best answer or still need to experiment.”
Accelerating Analysis
To make such iteration as accessible and fast as possible, McClure says ResFrac is finding ways to optimize simulations without sacrificing fidelity. For example, it is implementing a technique called distributed memory parallelization that splits the necessary processing across multiple computers, which should allow users to run larger simulations in a reasonable time.
“We have a test case where a one-stage simulation runs in about an hour, but once we kick it up to four stages, the time required jumps to 13 hours without distributed memory parallelization,” he says. “With it, the time falls back to an hour,” he illustrates.
Unless operators have unusually detailed information on the geology in each stage, it’s rarely worthwhile to simulate every stage, McClure says. However, it can be valuable to look at representative stages when operators have a reason to use different designs at various points in the lateral. For example, in some plays, such as the Montney, operators often know they will see significant geological changes across the lateral and want to determine if those variations warrant design changes.
Multiple simulations can also be useful when offset or parent wells overlap with part of the new well’s lateral but will likely have little influence on other parts, McClure adds.
Aside from speeding up large-scale simulations, McClure says ResFrac is enhancing its software’s ability to explore chemical interactions, including the ones associated with surfactants, acid fracturing and enhanced oil recovery. The company has also added features for automatically generating PowerPoints that summarize the results of a simulation, McClure says.
“One of the areas of active work we’re excited about is how we use artificial intelligence,” he says. “We think it can automate many steps in the engineering workflow, such as setting up the simulation, calibrating it, and summarizing the results. That will save the human users time and let them focus on critical thinking. It also means companies can scale digital twins and design optimization across more wells.”
Why Engineering Matters
The rewards for optimizing frac designs can sometimes be difficult to fully appreciate, says Carl Montgomery, a senior engineer with NSI Technologies. “Fracturing is a very forgiving technology,” he reflects. “Kick more sand into the well, and you will usually make a better well. As a result, people don’t do as much engineering as they used to.”
Instead, many companies favor an empirical approach. To minimize risk, they default to designs that seem to be working for nearby wells. If they need to answer a question, such as whether the logistical savings associated with in-basin sand outweigh the benefits of higher-quality proppant, they’ll try it and see.
Trial-and-error can yield valuable insights, but Montgomery urges operators to augment it with proven engineering workflows that tailor the design to the reservoir. “Basing the frac design on the rock, the kind of oil in the reservoir, the permeability, and other factors leads to better wells,” he explains. “I’ve had an opportunity to go through that workflow many times in my career, and every time, it’s let me identify changes that improve well economics.”
The most basic customization workflow is simple enough that it can be performed with an Excel spreadsheet if a company lacks access to more sophisticated tools, Montgomery mentions. The only requirement is data.
“Fracturing is a mechanical process, so to optimize it, a company needs to know the mechanical properties of the rock. They need to run logs, and those logs need to be calibrated to the rock they are dealing with,”
A well-calibrated geological/geomechanical model can reveal how the rock will react to different designs, but to tie that to production, engineers also need to understand the reservoir fluids and the permeability, Montgomery advises. With that information, he says they can zero in on the designs that will maximize recovery rates, returns and EUR.
Propping More Fractures
Montgomery stresses that effective completions must fill the fracture network with proppant. “We can pump all this fluid to create a huge fracture network, but if significant portions of it never receive proppant and quickly close, they will have a limited effect on production,” he says.
The thing to remember, he emphasizes, is that “any proppant is better than no proppant.”
Unfortunately, the situation when a fracture is created but not propped is common. “In the data I’ve seen, only about 30% of the created fracture network is propped well enough to be effective long term,” Montgomery reports. “We will never prop 100%, but we should be able to get to 60% or 70%.”
That change could move recovery rates from 5%-8% of the original oil in place to about 15%, Montgomery estimates.
Proppant only reaches a small fraction of today’s fracture networks largely because gravity causes it to settle out of the fluid. Stoke’s Law outlines three ways to address that proppant transport issue: increasing the fluid’s viscosity, using a less dense proppant, or reducing the proppant’s size. “The smaller the proppant is, the farther it can go,” Montgomery says.
That claim isn’t theoretical. Citing numerous case studies, Montgomery says including small but durable ceramic microproppants in the completion schedule usually leads to higher production. The average uplift is 15%, but Montgomery reports he has seen increases as high as 80%.
Even with a more modest uplift, Montgomery says microproppant typically pays for itself within six months. Coupled with its consistent performance, the relatively quick payback period has made microproppant an attractive investment for operators that prioritize long-term production over minimizing completion costs.
Biomarker Validation
Biomarkers can link production to specific zones because the oil from each zone has a unique fingerprint, Montgomery says. To identify those fingerprints, geochemists use drill cuttings from various depths.
When a large independent used biomarkers to fingerprint the oil produced by wells targeting the Wolfcamp D, it noticed that the wells had some short-term production from the upper Wolfcamp C. This was attributed to fracture height growth from the D into the C.
In a well that had a similar completion design but used microproppant, the production from the upper Wolfcamp C endured. This can be attributed to the frac fluid carrying the small proppant into the upper C, where it provided some long-term conductivity.
That experience fits with a broader trend, Montgomery says. “Biomarker experts tell me that after many fracs, they see oil coming from the upper zones. However, within 30 days, that oil disappears,” he shares. “The reason for that is likely because the fractures there do not have much proppant and quickly pinch off.
“Biomarking is a valuable diagnostic tool,” Montgomery says. “In fact, it is one of the ones I’m most excited about. For a relatively small investment a biomarker study can tell how much of the well’s total production each zone contributes, and where the oil comes from.”
According to Montgomery, those insights will make it easier to compare completion strategies. “For example, I could do a set of wells with a cross-linked gel and another set of wells with a linear gel to see if they lead to different fracture geometries, if one grew up more in height or length.”
Since biomarker technology involves looking at oil samples at surface, it’s an affordable way to monitor how production changes over time, Montgomery adds. “Geochemists can look at the decline curve and see whether the lost production comes from one zone that is pinching off or multiple zones,” he says. “They can also compare the production stream’s fingerprints before and after a refrac to see whether the refrac opened new rock or just enhanced production from existing rock.”
Unseen Viscosity Loss
In addition to adopting and refining microproppants, Montgomery says the industry may be able to improve proppant transport and therefore the extent of the effective fracture network by increasing viscosity. He cautions that frac fluid’s viscosity is often less than traditional models assume.
That observation comes from research conducted by one of NSI’s joint industry projects. “During a full-scale frac job in Utah, the project used a linear gel that had viscosity around 20 centipoise,” Montgomery describes. “However, when that gel went through the perforations, the viscosity dropped to one. The shear rate through the perforations was so high that it tore the polymer up.”
The shear rate there is around 200,000 reciprocal seconds. For comparison, Montgomery says the rate in the production tubing is only 1,100 reciprocal seconds. In the fracture network itself, it drops down to 40, but by that point, the damage has already been done.
“The only data I’ve seen on shear-induced viscosity loss is for linear gels, but I suspect something similar happens to cross-linked gels,” he says. “To preserve frac fluid viscosity and improve proppant transport, we will likely need more robust chemistry.”
For other great articles about exploration, drilling, completions and production, subscribe to The American Oil & Gas Reporter and bookmark www.aogr.com.