








Combining Microseismic, Tracers Illuminates Key Effects Of Frac Treatment Designs
By Jonathan P. McKenna
HOUSTON—Hydraulic fracturing is designed stage by stage, but the reservoir responds as a connected system. Every injection alters pore pressure and stress around the treated rock. Those changes influence the next stage, the next well, and in some cases, older producing wells on the pad. The challenge is that no single diagnostic tells the entire story.
Microseismic monitoring shows where the rock deforms and how the local stress field changes during stimulation. Well-specific tracers show where injected material is later produced. Used separately, each technology answers an important question. Used together in combination, they can test whether an interpreted fracture network actually transported fluid between wells and can reveal why treatment order and timing matter, giving completion teams a clearer view of fracture containment, parent-child communication and the treatment timing decisions that can improve well performance.
Two field studies—one in the Wolfcamp Formation of Southeast New Mexico and one in the Niobrara Formation of the Denver-Julesburg Basin—illustrate the value of this integration. The results indicate that stimulation-induced stress changes can remain elevated for roughly seven days. During that interval, a stress shadow can help contain later injections near the treatment well or push slurry away from a recently stimulated offset. After the stress dissipates, newly injected fluid can move through previously opened fractures and communicate with wells thousands of feet away.
When a stage is pumped, pressure rises in and around the newly activated fracture network. The surrounding rock does not immediately return to its original condition when pumping stops. Instead, the altered pore pressure and stress field can persist while fluid leaks off and pressure dissipates. This temporary zone of increased stress is commonly described as a stress shadow.
A stress shadow can be useful. If a neighboring stage is treated while the altered stress remains in place, the pressure barrier can limit fracture growth into the recently stimulated area and redirect injected slurry volume toward less-pressurized rock. That can improve near-wellbore containment and reduce immediate communication with an offset well. However, the effect is time dependent. Once the pressure barrier relaxes, the previously created fracture network may become a preferential pathway for later injections.
This makes completion timing an operational variable rather than a scheduling detail. A treatment sequence that preserves a useful stress barrier may keep proppant closer to the intended stage. A long delay may allow a later treatment to re-enter fractures created by an earlier well, reducing treatment efficiency around the active stage and increasing the risk of unwanted parent-child communication.
Wolfcamp Study Results
In the Wolfcamp study, microseismic focal mechanisms were used to separate events associated with the background virgin stress state from events associated with altered stress. The virgin maximum horizontal stress orientation was approximately N80 degrees E. During stimulation, the interpreted maximum horizontal stress rotated about 24 degrees in either direction, while horizontal stress anisotropy decreased.
The spatial pattern was consistent with a pressure barrier wrapping around the treatment area. Events matching the virgin stress state were concentrated closer to the wellbore. Events matching left- and right-rotated stress states occurred on opposite sides of the well (Figure 1). The altered-stress regions were interpreted as higher-pressure areas that resisted additional slurry propagation, while the virgin-stress population was more representative of the path into relatively unpressured rock.
FIGURE 1
Stress State Distribution
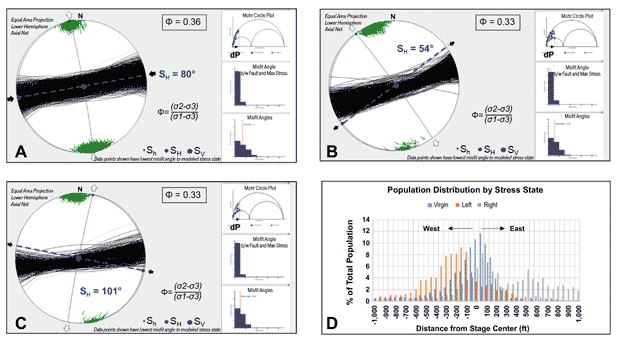
Microseismic focal-mechanism analysis distinguishes the virgin stress state from left- and right-rotated altered stress states. The altered populations occur on opposite sides of the wellbore, consistent with stimulation-induced stress changes.
A stage-lag analysis then compared the time between treatments on neighboring wells with the location of microseismic events. For stage lags shorter than about seven days, deformation associated with the virgin stress state remained comparatively close to the treatment well. At longer lags, pressure had dissipated enough for later injections to enter fractures created during earlier treatments.
That distinction is important because a large microseismic cloud does not automatically equal an equally large propped and conductive fracture network. Some events may represent pressure communication or reactivation of existing fractures without significant slurry transport. Focal-mechanism and stress-state interpretation help separate broad rock response from the portions of the network most likely to accept additional fluid and proppant.
Modeling of the Wolfcamp dataset compared three completion conditions: an isolated treatment, a rapid zipper sequence and a long-delay sequence. The isolated and rapid zipper cases kept most modeled proppant relatively close to the active well. In the rapid zipper case, pressure associated with nearby treatments created boundaries that contained slurry between higher-stress regions and biased the treatment away from recently stimulated rock.
The long-delay case behaved differently (Figure 2). A deeper well was treated 17.8 days after a shallower offset. By that time, the stress shadow had largely dissipated, and the later injection moved upward through fractures generated during the earlier stimulation. The same fracture network that had been created to improve reservoir contact became a pathway away from the intended treatment area.
FIGURE 2
Stage Lag Proppant Distribution
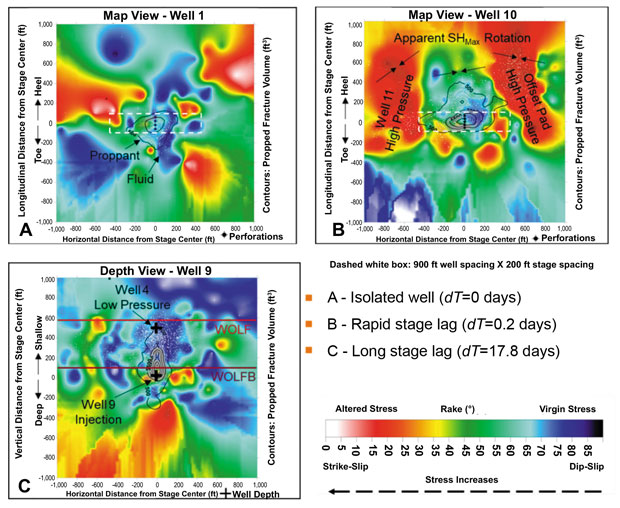
Shown here are modeled proppant distributions for an isolated well (A), a rapid stage-lag zipper sequence (B) and a long stage-lag case (C). The long delay example shows fluid moving into a previously created fracture system after the pressure barrier dissipated.
For a completion team, the economic implication is straightforward. Changing treatment order or reducing avoidable stage lag is far less expensive than changing well spacing, adding major equipment or remediating an underperforming child well. The value comes from placing more of the fluid and proppant where it can contribute to the active well rather than sending it into depleted rock or an offset fracture system.
DJ Basin Study Results
The Denver-Julesburg Basin study provided a second dataset and an independent diagnostic. Well-specific solid tracers were blended with proppant during treatment. After contacting oil, the tracers became mobile and could be measured at producing wells. The recovery pattern was then compared with predictions based on microseismic geometry, stress orientation and the time between offset treatments.
The Niobrara stress inversion indicated a maximum horizontal stress orientation near N125 degrees E. That direction was used to identify the offset stages most likely to interact and to calculate stage lag in the dominant fracture-growth direction rather than relying only on the apparent order shown on a surface map. This is a practical point: the well numbered next in the schedule is not necessarily the well most influential to the active stage. The meaningful neighbor is the stage positioned along the expected direction of fracture growth.
The tracer results (Figure 3) supported the time-dependent stress-shadow interpretation. When adjacent wells were treated within the approximately seven-day window, tracers from the later well tended to be pushed away from the recently stimulated partner. When the delay was longer, communication increased through the existing network.
FIGURE 3
Tracer Recovery and Prediction
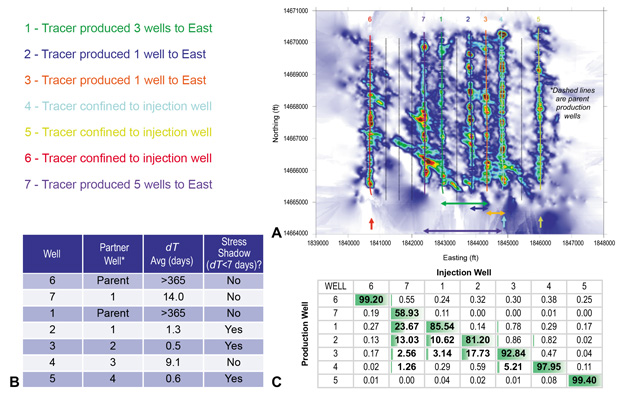
Tracer recovery is shown here compared with stage-lag predictions and the microseismic-derived fracture network. The recovery pattern shows both near-well containment and long-distance communication, depending on treatment timing and the surrounding pressure state.
One well treated about 14 days after the first well on the pad produced tracer on multiple offset wells as far as roughly 2,500 feet to the east. Across the study, tracer was observed as far as 3,000 feet from the injection well. That distance is difficult to explain from treatment geometry alone. The combined interpretation indicates that pressure had dissipated sufficiently for the later injection to access fractures opened during earlier stages.
Tracer also adds discipline to the interpretation. If microseismic suggests a connection but tracer does not appear at the offset well, the events may represent deformation or pressure transmission rather than meaningful fluid transport. If tracer appears where the mapped microseismic response is limited, the result may point to an efficient pre-existing pathway or a portion of the network that was poorly illuminated. Either outcome improves the next completion design because the team is comparing two independent observations rather than relying on one diagnostic to answer every question.
Better Basis For Decisions
The practical value is not another complicated model. It is a better basis for decisions that can be made before and during the completion. Treatment order is one of the least expensive design variables to change, yet it can materially influence fracture containment and interwell communication.
Where containment is the objective, neighboring stages can be scheduled so stage lag remains shorter than the locally measured stress-dissipation time. Treatment order should be evaluated in the direction of maximum horizontal stress, not just by well number or the sequence visible on a map. Where upward growth is expected, treating deeper wells soon after shallower wells may allow the remaining stress shadow to reduce vertical communication. In parent-child developments, the same workflow can identify whether the active treatment is being drawn toward depleted producers or redirected by recently stimulated child wells.
The seven-day interval observed in these datasets should not be treated as a universal rule. Dissipation time will vary with rock properties, pressure, natural fractures, fluid system, spacing and operational sequence. The transferable lesson is the workflow: measure the stress response, quantify how it changes with time, and verify the inferred flow paths with an independent diagnostic.
A calibrated workflow can also support future pad designs. Once a team understands the local stress orientation, dissipation behavior and tracer response, it can use those findings to adjust zipper sequences, reduce idle time between related stages, prioritize wells where communication risk is highest, and evaluate whether more expensive mitigation measures are justified. The result is not only a clearer subsurface picture, but a more defensible allocation of completion capital.
The integrated approach can support more than one unconventional completion question. It can clarify parent-child interactions, identify pathways into depleted wells, test zipper frac timing and help distinguish broad fracture activation from effective proppant placement. It can also inform refracture planning by showing whether a new treatment is creating fresh reservoir contact or simply reopening an established network.
In conventional reservoirs and enhanced recovery projects, the same division of labor applies. Microseismic can identify where deformation occurs while tracers help determine whether injected fluids reach intended producers or escape through unexpected connections. The technologies are complementary because they observe distinct parts of the system: microseismic records the rock response to changing pressure, while tracers record where injected material ultimately appears.
Agreement between the two increases confidence. Disagreement is equally valuable because it can expose unpropped deformation, pressure communication without significant fluid transport, or transport along pathways that were not obvious from either dataset alone. That is the point of integration: not to force two datasets into the same answer, but to use each one to challenge and refine the other.
Completion diagnostics are most useful when they change an operating decision. These field examples show that the reservoir retains a memory of prior treatments, but that memory fades. The sequence and timing of stages determine whether the temporary stress field acts as a containment barrier or whether a later injection re-enters an established fracture network.
Microseismic monitoring provides the time-resolved picture of deformation and stress. Tracers provide the production-side validation of fluid movement. Together, they allow operators to move beyond asking whether wells communicate and begin answering the more useful questions: when, in which direction, through what pathway, and what can be changed on the next pad?

Jonathan P. McKenna is completions evaluation team leader at MicroSeismic Inc., where he interprets microseismic, focal-mechanism, stress and fracture-network data for hydraulic fracture evaluations. His work includes field studies of treatment sequencing, proppant distribution and interwell communication in major U.S. unconventional basins. McKenna has authored and presented technical research for industry conferences and publications. He holds a doctoral degree and applies geophysical analysis to practical completion-design and reservoir-development decisions.
For other great articles about exploration, drilling, completions and production, subscribe to The American Oil & Gas Reporter and bookmark www.aogr.com.