


Fiber Optic-Based Diagnostics Reveal Completion Insights On HFTS-2 Project
By Nancy Zakhour, Matt Jones, Yu Zhao, Kate Orsini and Vinay Sahni
HOUSTON–As part of a study on completion design at the Hydraulic Fracturing Test Site-2 (HFTS-2) in the Delaware Basin, permanent fiber optic (FO) cable was used to acquire unique near-wellbore and far-field surveys to evaluate spatial and temporal hydraulic fracture characteristics.
Diagnostics included monitoring of both stimulation and production performance with the objective of improving stimulation distribution effectiveness (SDE) for various completion designs.
The integration of distributed acoustic sensing (DAS), distributed temperature sensing (DTS) and hydraulic fracturing treatment data allows a detailed and comprehensive analysis of SDE across perforation clusters (PCs). Qualitative and quantitative information gained through the integrated analysis supports an improved understanding of whether the PCs within a stage were treated evenly as planned, and how different completion designs and operational issues affect stimulation efficiency.
Figure 1 shows near-wellbore DAS/DTS and treatment data (from top to bottom) in time-synchronized panels for 7 stages with operational issues on Boxwood-4H. With the start of injection on the stage, DAS clearly showed high-energy signal responses indicated by warmer colors and corresponding to fluid and proppant placement for the six PCs, annotated as 7.1 to 7.6 from toe to heel.
FIGURE 1
Near-Wellbore DAS/DTS and Treatment Data for Seven Boxwood-4H Stages with Operational Issues (Red Cross = Plug Location)
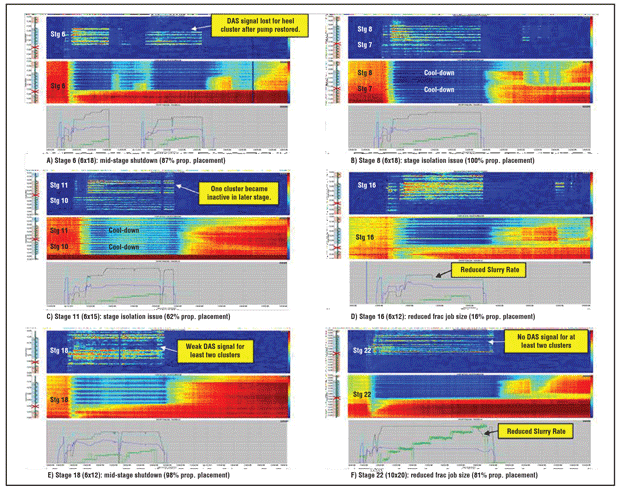
The DAS energy signals remained active for all clusters until the end of the treatment, when the pumps were shut down. Because fracturing fluid was injected with a relatively lower temperature, the DTS temperature waterfall map in the middle showed a cooling effect, indicated by cooler colors in the near-wellbore region during the treatment of the six PCs, followed by a warming effect shortly after the end of treatment.
The integrated analysis of near-wellbore DAS/DTS and treatment data can be used to better understand the adverse impacts of completion operational issues. These operational issues can include plug failures, poor cement bonding behind casing, operational challenges leading to mid-stage shutdowns and others.
Operational efficiency is critical to ensuring proper placement of the fracturing treatment within a given stage. All the PCs in Stage 6 received treatment early in the stage, as evidenced by high DAS energy signals (Figure 1A). When pumping resumed after the mid-stage shutdown caused by a pump reliability issue, DAS energy signals were clearly lost for a single heel PC, which remained inactive during the rest of the treatment, while the other PCs remained active and may have taken additional fluid and proppant beyond the designed amounts.
Figures 1B and C show the lack of isolation during the treatments of Stage 8 and Stage 11 based on clear DAS/DTS responses in the previous stages. Specifically, the DAS/DTS response lag in Stage 7 during the treatment of Stage 8 indicates flow behind casing, potentially attributable to poor cement bonding or a longitudinal fracture connection. Alternatively, the immediate and stronger DAS/DTS response in Stage 10 when Stage 11 was being stimulated implies a probable plug leak or failure.
In Figure 1D, the reduced frac job size during the treatment of Stage 16 led to only 16% of actual proppant placement compared with the original design. Figure 1E and 1F show similar adverse impacts of operational inefficiency on the treatment of PCs and fluid/proppant placement.
Productivity Observations
The observations and interpretations are applicable to most stages on the Boxwood-3H and 4H wells. Almost all the stages on the Boxwood-1H and 2H were treated as designed without much deviation. However, a fair number of stages on the Boxwood-3H (~32%) and Boxwood-4H (~15%) wells received less proppant than designed, which coincides with the stages that experienced issues during the stimulation, partly because of operational problems and partly because of suspected cement isolation issues.
This observation aligns with the production performance characteristics of the Boxwood wells: Boxwood-2H is the best performer, whereas Boxwood-3H is the worst performer, clearly highlighting the impact of operational efficiency and success on well productivity and overall performance.
FIGURE 2
Near-Wellbore DAS/DTS and Treatment Data for Stage 7 on Boxwood-4H (Yellow Star = Frac Hit)
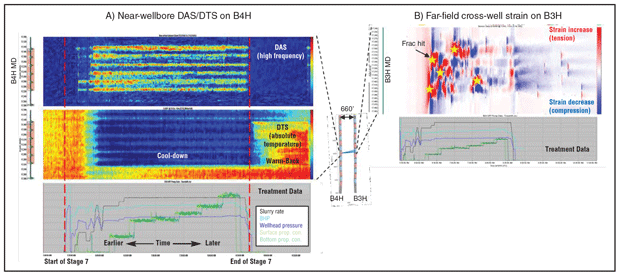
The unique layout of the two horizontal fiber wells allowed the acquisition of far-field cross-well strain (FF CWS) data from one fiber well when another fiber well was being treated. Figure 2 shows the integration of near-wellbore DAS/DTS acquired during the treatment of Stage 7 on Boxwood-4H and the FF CWS data recorded by the offset monitoring well Boxwood-3H. Near-wellbore DAS/DTS (Figure 2A) clearly shows that six hydraulic fractures were initiated during the treatment of Stage 7 on Boxwood-4H, while only five frac hits (indicated by the yellow stars in Figure 2B) were interpreted based on FF CWS signals on Boxwood-3H.
Provided that similar geological stresses exist, the smaller number of frac hits on the offset well potentially may reflect the stimulation inefficiency and resulting nonuniform distribution of energy and fluid/proppant placement among the PCs.
Stimulation Efficiency Analysis
Through the integration of fracture stimulation data and relative amplitudes of DAS frequency band extracted data, fluid and proppant distribution among PCs can be calculated based on mass balance. The resulting hydraulic fracture profile (HFP) enables further analysis of stimulation efficiency as well as comparison of various completion designs in a more detailed and quantitative manner.
During the treatment of each stage, the preferred and recommended scenario is to stimulate all PCs efficiently by achieving an even distribution of fluid and proppant throughout the interval. Realistically, a number of factors influence the chance of success, such as completion designs and PC configurations along with heterogeneity and anisotropy of geological and geomechanical properties in the formation. There are multiple ways to evaluate stimulation efficiency quantitatively.
To allocate proppant placement, the project grouped clusters into three categories based on the percentages of proppant placed per PC divided by the percentage of designed proppant per PC for Boxwood-3H and 4H. PCs receiving more than 150% planned proppant were considered “super-clusters,” while those receiving less than 50% planned proppant were “poorly treated.” Ideal values are 100%, representing perfect proppant allocation. There was a small range of spread, indicating relatively uniform treatment for most stages.
The results indicate better SDE in standard stages (mostly five-six PCs/stage) than in extended stages (eight-ten PCs/stage) on the Boxwood-4H. On Boxwood-3H, however, the proportions of the three categories are similar for both standard and extended stages, which is probably attributable to the more frequent operational issues encountered on the standard stages leading to similar results.
Proppant Distribution Metric
Another metric developed for improving SDE evaluation is referred to as the proppant distribution metric (PDM), which is defined as the ratio of minimum to maximum actual PC proppant placement for each stage. PDM can be employed to evaluate various completion designs more concisely to analyze key performance drivers for SDE. The value of PDM can range between 0 and 1, with higher PDM values implying better stimulation efficiency.
Looking at the average treatment rate per cluster (RPC) and corresponding PDM for all stages, the results show that among the stages with the same completion design, operational issues appear to increase risk to stimulation efficiency, leading to a lower PDM value. There was a strong positive correlation (0.61) between PDM and RPC for stages on the Boxwood-4H, and a consistent but weak positive correlation (0.31) for stages on the Boxwood-3H (the stages that encountered operational issues were removed for correlation calculations).
Higher RPC values (10-13 bpm/PC) appear to improve SDE, especially for stages with a higher number of PCs/stage. All the stages on the Boxwood-3H and 4H wells were treated at an average rate of 60-70 bpm, regardless of PC count.
The correlation between PDM and average treatment rate per perf (RPP) is shown in Figure 3. There is a weak negative correlation (-0.30) between RPP and PDM for the stages on the Boxwood-4H, and an inconsistent and very weak positive correlation (0.11) for the stages on the Boxwood-3H. This statistical analysis of HFP and SDE clearly shows that RPC is a more effective metric and design variable than RPP, which is more commonly used in the industry.
FIGURE 3
Average Treatment RPP versus PDM
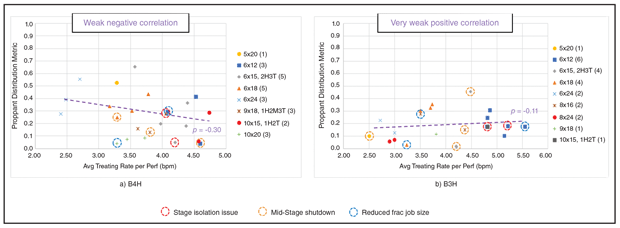
Excessively high values of RPP (greater than four bpm/perf) tend to produce uneven proppant distribution, probably because of erosional effects. If RPC was not maintained at a certain level (greater than 10 bpm/PC), the likelihood of uneven proppant distribution increased dramatically. The stage configurations that created low RPC while maintaining high RPP did not show improved SDE. In addition, no obvious effects of tapered PC schemes or perforation orientation/phasing were observed during the treatments of the Boxwood-3H and 4H. Note that the completion design for both wells was based on 32-foot PC spacing, which was a fixed variable associated with the fiber optic clamping and protection system.
Production always provides the ultimate assessment of SDE for different completion designs, but no conventional production logging was conducted in the HFTS-2 project. To fill this gap, the DSS data acquired during the production phase of the Boxwood wells enables further analysis of fracture property changes in the near-wellbore region potentially associated with SDE and longer-term production performance.
Production Logging Test
To analyze near-wellbore frac property changes, a unique FO-based well interference and production logging test was implemented on the HFTS-2 wells, inspired by a proprietary procedure developed by ConocoPhillips. The test was executed on four Boxwood wells (1H, 2H, 3H, and 4H) and one Bitterroot well (1H) by cycling between “open” and “shut-in” for a few hours after an extended period of stable production. Because the FO cable was installed and operating reliably on Boxwood-4H, this well was the primary target for monitoring and FO data acquisition during the test.
After overcoming several operational challenges, the test was completed successfully, and the data was collected as planned. Through comprehensive analysis of the DAS data and pressure gauge responses, no identifiable well interference was observed between Boxwood-4H and the offset wells. The near-wellbore strain change data acquired using a newly developed FO technique was analyzed to gain insights on time-dependent fracture property changes when the Boxwood-4H was shut in or producing.
To confirm the test results, a second FO sensing test was conducted approximately seven months later with extended shut-in time, offering a better opportunity to confirm the well interference. Overall, the test was executed similarly to the previous test, with precautions to avoid unnecessary facility shut-ins and automation constraints. DSS-RFS data was acquired on all three fiber wells, which enabled the investigation of time-lapse fracture property changes in the near-wellbore region.
DSS-RFS Interpretation
The analysis and interpretation of DSS-RFS data acquired in the two FO sensing tests can provide critical, high-resolution information for near-wellbore fracture property changes after seven months of production.
Since the entire FO cable on the Boxwood-4H was fully operational during the two tests, the analysis and interpretation of DSS-RFS data are specific to that well. Figure 4 shows the bottom-hole pressure buildups during shut-in periods in both the first and second tests. The total liquid production rate before the first test was higher than before the second test, so the BHP buildup rate is faster during the first test. Because near-wellbore strain change is highly related to BHP changes, two separate time stamps of when the BHP buildup reached 1,000 psi in these tests were selected for comparison.
FIGURE 4
BHP Buildup During Shut-In Periods

Figure 5 integrates near-wellbore strain change data at the selected time stamps with DAS data acquired during well stimulation for Stages 21 and 22 on the Boxwood-4H. There is significant correlation between the two independent datasets acquired in different stages of the well lifecycle by different vendors. For red-circled clusters that were poorly treated, there is no identifiable positive strain change as BHP builds.
Near-wellbore DAS in Figure 5A shows that the four red-circled PCs were poorly treated, based on very weak or nonexistent DAS energy responses during stimulation. In Figure 5B, the blue and yellow curves represent strain changes in the near-wellbore regions of Stages 21 and 22, respectively, at the two selected time stamps shown in Figure 4.
FIGURE 5
DAS (Stimulation) versus DSS-RFS (Shut in) for Boxwood-4H Stages 21 and 22
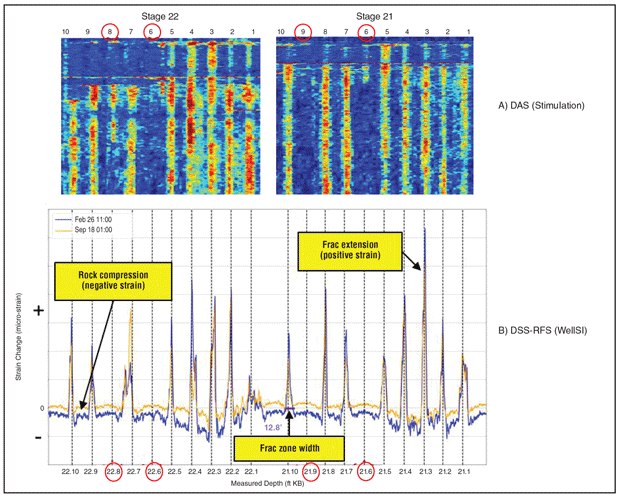
With such a consistent and repeatable pattern, the amplitude of near-wellbore strain change on the first test was larger than that on the second test for most PCs, even though BHP buildup was the same, potentially because of complex time-lapse changes in the near-wellbore region and different production rates prior to the test.
The fracture zone width was estimated based on the range of positive strain change for each PC. For instance, the fracture zone width for PC 10 in Stage 21 is 12.8 feet. The integral of the strain change value and fracture zone width gives the fracture aperture change, which is an important parameter of fracture geometry and plays a key role in fracture performance.
Despite achieving the same BHP buildup at the selected time stamps, the first test exhibits greater strain change than the second test, and such was the case for most of the stages on the Boxwood-4H, especially for the PCs belonging to the extended stages (nine-ten PCs/stage).
During the first FO test, DSS-RFS information also was acquired for a short period when all Boxwood wells were in a state of stable production before Boxwood-4H was shut in. Because of the short measurement time and the small BHP drawdown, clear strain change in the near-wellbore region during production was observed, but with much smaller amplitude and reversed polarity when compared with the strain change during the well shut-in period. A strong correlation was observed between shut-in and production peak strain change values for both standard and extended stages.
Fracture Aperture Changes
Finally, the project assessed time-lapse fracture property changes versus the HFP. Since no conventional production logging was conducted on the Boxwood wells during this project, the study attempted to link stage treatment to possible stage production performance associated with cumulative fracture aperture changes, which show desirable alignment with the HFP (i.e., proppant distribution). In general, the stages that received less proppant because of operational issues showed smaller fracture aperture changes during the shut-in periods.
It is interesting to note the inconsistency between proppant allocation and fracture aperture changes for Stages 16 and 18 of Boxwood-4H, which have the same completion design. The analysis revealed that better SDE was achieved in Stage 16 than Stage 18, which would partially explain why Stage 18 received more proppant than Stage 16, but it experienced less fracture extension as the BHP built up.
The analysis indicates larger fracture aperture reduction and possible productivity decay in extended stages with more PCs per stage after seven months of production. This may be attributable to the low SDE during the treatment of extended stages, where the calculated proppant distribution metric appears to be below 0.2.
Key Conclusions
The project’s workflow quantitatively evaluated SDE for different completion designs using diagnostic results and could help optimize completion strategy for future development projects. The analysis and interpretation of results demonstrate the technical feasibility of using permanent FO cable for stimulation and production monitoring and indicate a strong correlation between proppant/fluid allocation and time-lapse near-wellbore fracture property changes.
Among the key conclusions of the study are:
- Even distribution of proppant and fluid was best achieved with geometric PC schemes that targeted 2.5-3.0 barrels per minute/perf and 10.0-12.5 bpm/PC.
- Based on the statistical analysis of hydraulic fracturing profiles with effective limited entry practices, RPC during proppant slurry placement appears to be a primary completion design variable rather than the typical default consideration, RPP.
- If RPC is not maintained above 10 bpm/PC, the likelihood of uneven distribution increases dramatically. The stage configurations that created low RPC while they maintained high RPP did not show improved SDE.
- All stages on the Boxwood-3H and 4H wells were treated with an average rate of 60-70 bpm, regardless of PC count. Higher RPC values (10.0-12.5 bpm/PC) may help improve SDE, especially for extended stages.
- No obvious effect of tapered PC schemes or perforation orientation/phasing was observed during the treatment of the Boxwood-3H and 4H.
- Based on near-field DAS/DTS data, completion operational issues (such as poor cement bonding behind casing, mid-stage shutdowns and plug failures) add the risk of degradation of SDE.
- The strain change results based on DSS data acquired during production clearly indicate near-wellbore fracture property changes (such as aperture changes during well shut-in and flow periods) and align with near-wellbore DAS signals acquired during stimulation.
- Fracture property changes based on DSS data acquired during two tests seven months apart showed high consistency and good alignment with near-wellbore hydraulic fracturing profiles.
Editor’s Note: The preceding is the second in a two-part article on a completion design study at the HFTS-2. Part I appeared in AOGR’s May issue.
This material is based on work supported by the U.S. Department of Energy under Award Number DE-FE0031577. For more detailed information on the results, see URTeC 5242, a technical paper prepared for presentation at the 2021 Unconventional Resources Technology Conference, held July 26-28 in Houston.
The authors thank Richard Sullivan, Robert Anderson, Vikram Sen and Alan Reynolds for their diligence in planning and executing this project, and thank all field personnel and vendors who ensured efficient operational execution and data acquisition of the rich dataset.
NANCY ZAKHOUR is a business development manager with Oxy Low Carbon Ventures. Previously, she was a Permian Basin well design lead at Occidental, managing drilling, completion, and production engineering design and optimization. Zakhour chaired the HFTS-2 completion engineering subcommittee. Prior to that, she was a completion engineering adviser. Before joining Occidental, Zakhour was Callon Petroleum’s completion engineering adviser and served in technical and field operational roles at Schlumberger. A recipient of the SPE Regional Completions Optimization & Technology Award, she holds a B.S. in electrical and computer engineering from the American University of Beirut and an MBA from Rice University.
MATT JONES is member of Occidental’s unconventional reservoir stimulation design team, focusing on fracture modeling and field development. From 2014 to 2019, he served at Anadarko first as a production engineer in the Eagle Ford and then as a completions engineer in the Delaware Basin. When Occidental acquired Anadarko in 2019, Jones transitioned to completions engineering supervisor for the Delaware Basin asset. He also has served as a completions engineering adviser for Occidental’s worldwide drilling & completions team. Jones holds a B.S. in petroleum engineering from Texas A&M University.
YU ZHAO is a reservoir engineer at Occidental, where he mainly conducts integrated unconventional simulation to support primary and EOR development in the Delaware and Midland basins. He also evaluates new unconventional technology for practical applications, and has extensive interests and experience in fiber optic data analysis and interpretation. Zhao is a technical reviewer for “SPE Journal,” “SPE Reservoir Evaluation & Engineering,” and “Journal of Petroleum Science & Engineering.” He holds a Ph.D. in petroleum engineering from the University of Tulsa.
KATE ORSINI is a production engineer at Oxy. Since joining the company in 2019, she has worked in the Delaware Basin in Loving and Reeves County, Tx., focusing on production optimization, artificial lift design, and well stimulation and remediation. Orsini holds a B.S. in petroleum engineering from The University of Texas at Austin.
VINAY SAHNI works for Oxy’s Permian EOR business to develop field development plans for carbon capture, utilization and storage/carbon capture and sequestration projects. Permian EOR development responsibilities also include longer-term planning and portfolio optimization via acquisitions and trades. Sahni previously provided technical support to help optimize primary and EOR development plans for Occidental’s unconventional resources business units. Sahni holds a B.S. in petroleum engineering from Pune University and an M.S. in petroleum engineering from the University of Texas at Austin.
For other great articles about exploration, drilling, completions and production, subscribe to The American Oil & Gas Reporter and bookmark www.aogr.com.