


Five-Well STACK Pad Study Analyzes Production Impacts Of Parent-Child Interactions
By Dave Ratcliff, Mark McClure, Garrett Fowler, Brendan Elliott and Austin Qualls
OKLAHOMA CITY–Devon Energy performed a study in the Anadarko Basin STACK play using a coupled “true” hydraulic fracturing and reservoir simulator to model the entire life cycle of wells associated with complex fracture driven interactions (FDIs) between the parent well and four infill child wells.
The model was constrained by sealed wellbore pressure monitoring, interference testing, pressure responses during frac hits, production data and responses to chemical treatment.
The model calibration process started by listing the key observations characterizing the dataset and then performing calibration in a step-by-step process.
First, the modeled fracture lengths were calibrated using sealed wellbore pressure monitoring. The propped lengths then were calibrated using pressure interference testing and offset wellbore pressure monitoring during FDIs. Third, production rates were calibrated by modifying permeability and relative permeability curves. Permeability estimates from diagnostic fracture injection tests (DFIT) further constrained the permeability estimates. Finally, child productivity and post-FDI parent well productivity were matched by varying the potency and the reaction rate of “conductivity damage reactions.”
The simulator includes conductivity damage reactions to capture negative impacts on parent well production. A single set of conductivity damage parameters (reaction rate and potency) were sufficient to replicate the productivity degradation observed during two separate FDIs one year apart on the parent and child wells.
In this manner, the full sequence of parent-child events was replicated in a continuous simulation. The calibrated model can be employed to identify strategies to mitigate negative impacts and design remediation strategies.
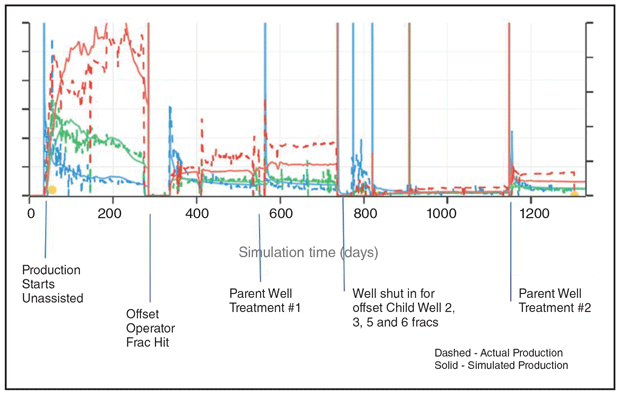
Figure 1 shows the timeline of events for each major production sequence that was matched to actual production. Permeability and relative permeability were altered in the model to match fluid production, while continuing to honor the fracture lengths from sealed wellbore pressure monitoring. In addition, DFITs were evaluated to confirm permeability.
FIGURE 1
Parent Well Production Phases
Parent Well Production
At two different times during the life of the parent well, an FDI experienced while stimulating an offset child well severely affected production. The first event occurred at approximately 300 days when child No. 1 was fractured just outside the drilling spacing unit. The second FDI occurred at approximately 750 days when child wells 2-6 were fractured. At surface, a “gummy bear-like solution” was recovered and the source of the damage was deemed to be conductivity loss in the fracture caused by child well fracture fluid-formation interactions that were clogging the fracture.
The formation of this damage material was modeled by introducing a generic material into the simulation: fracture conductivity damage. The damage material is modeled as being formed from a chemical reaction between the chemical additive in the frac fluid and/or the matrix or formation fluid. Because damage appears more severe during FDIs than during the initial frac jobs, it is assumed that the reaction is enhanced by interaction of frac fluid with the contents of a producing hydraulic fracture, and so the reaction rate is modeled as proportional to the hydrocarbon saturation in the fracture element. Even though frac fluid sweeps hydrocarbon out of the fracture as it invades during a frac hit, some hydrocarbon remains in the fracture elements as a residual saturation.
A reaction rate constant and a potency constant (which models how severely the reaction product damages conductivity) were varied to calibrate the model to the observed production changes. The simulator tracks the spatial distribution of friction reducer concentration as it is injected with frac fluid into the fractures, and tracks concentration changes as that friction reducer is consumed by the damage reaction and converted into conductivity damage material. The amount of conductivity reduction in each fracture element is related to the amount of damage material that has formed. The damage material is assumed to be immobile.
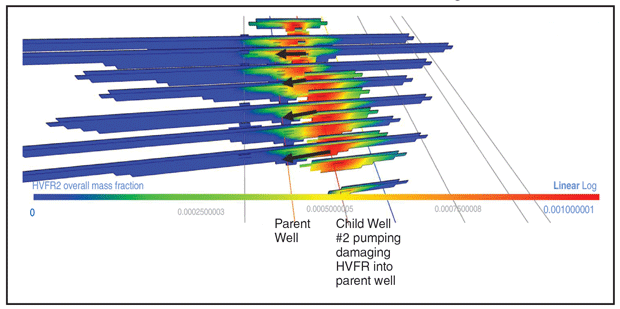
As the damaging fluid is pumped into the child wells, fractures either have coalesced or become hydraulically connected to the parent, allowing for the conductivity to form in parent fractures as well as child fractures closest to the parent. Figure 2 shows fluid progression from one wellbore to another, causing fracture conductivity damage.
FIGURE 2
Fluid Movement to Parent Well While Fracutring Child Well 2 (Caused Fracture Conductivity Damage)
The resulting lowered conductivity is manifested as lowered production. The post-FDI production was matched by allowing fluid flow from the child wells to the parent well, and by varying the potency and reaction rate to achieve the necessary fracture conductivity damage to match production results. The same reaction rate and potency is found to predict the productivity decline observed at 300 days and 750 days. The base relative permeability curves and permeability were never altered throughout the simulation.
It is also possible to model chemical treatment that removes damage. As seen in Figure 2, the field data showed increased production after chemical treatments were injected. In the simulator, the chemical treatments are modeled by defining a treatment water solute and defining a new reaction that occurs between the treatment solute and the conductivity damage.
In the simulation, the treatment solute was pumped at the actual rate and duration, scaled for the number of stages in the model, and the potency and reaction rate constant were tuned to match the observed production uplift. As the treatment solute was consumed by the reaction, the damage to fracture conductivity damage was reduced. The production uplift is a function of the amount of treatment fluid pumped and the amount of contact with the damaged fracture area.
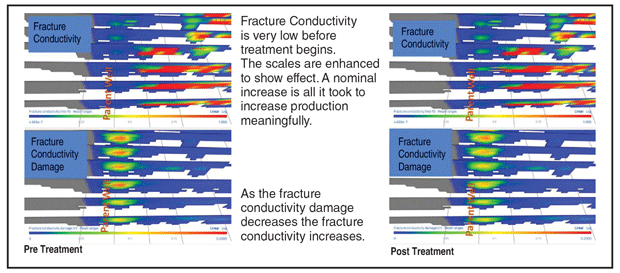
After the child well fracs hit the parent well, its production was nearly zero (Figure 1). However, Figure 3 shows the increase in fracture conductivity post-treatment that occurred after the child wells were fractured. It only took a modest increase (approximately 20%) in fracture conductivity to increase production meaningfully.
FIGURE 3
Pre- and Post-Fracture Conductivity and Fracture Conductivity Damage
Parent Well Water Cut Trends
With every successive FDI, the post-frac hit parent well production water cut increased. This was attributed to leak-off into the formation during the frac, causing a region of high water saturation around the fracture. In the simulator, “water banking” captures this effect by temporarily elevating the water cut during flowback. As the water leaks off from the fracture elements, the code tracks how much water has leaked off and assigns it to a water bank (a region of high water saturation around the fracture). As water flows back, the water bank is depleted and the effect weakens.
Typically, the matrix element thickness is much greater than the water bank thickness (~10 feet versus a fraction of an inch). Because the total matrix element is relatively large, the leak-off does not cause a significant change in saturation or relative permeability in the matrix element itself. Instead, to capture elevated water cut during flowback, the water bank treatment increases the water relative permeability (and optionally decreases the hydrocarbon relative permeability) during flowback to account for the effect of the water bank. The elevated relative permeability returns to normal as the water bank is depleted.
This allows both a temporary increase of water cut during the initial production, and increasing water cut after successive FDIs. Since water production is generally high at the beginning of production, the effect is normally temporary because the banked water is depleted quickly. After successive FDIs, the water production rate becomes progressively lower, so it takes more time to flowback the leak-off fluid and return the elevated relative permeability to original.
Water banking was used to match the temporary elevated production of the parent before frac hits. Since production post-FDI was low because of damage mechanisms, the water cuts tended to stay elevated.
Child Well Production
Child well production was the final observation to match. Child well production declined as the distance to the parent decreased. Child wells 2 and 3–the two infill wells closest to the parent–had the greatest production reduction, followed by child No. 5 and then 6. It should be noted that all these wells are bounded on both sides except for child No. 6 (farthest child well from the parent), which performed slightly worse than the parent well before the FDIs.
Figure 4 shows that the depleted region around the parent well does not extend past child No. 2. This result is based on the production volume history match, constrained by observations regarding total fracture length and propped length from the sealed wellbore pressure monitoring and interference tests. Thus, while it is possible that child No. 2 could experience reduced production from interference, it is harder to rationalize why child No. 3 also would experience production loss, since it is farther away from the parent well.
FIGURE 4
Parent Well Matrix Pressure Depletion
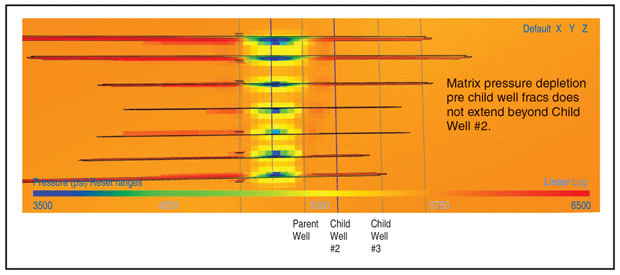
FIGURE 5
Fracture Conductivity Damage Across Pad
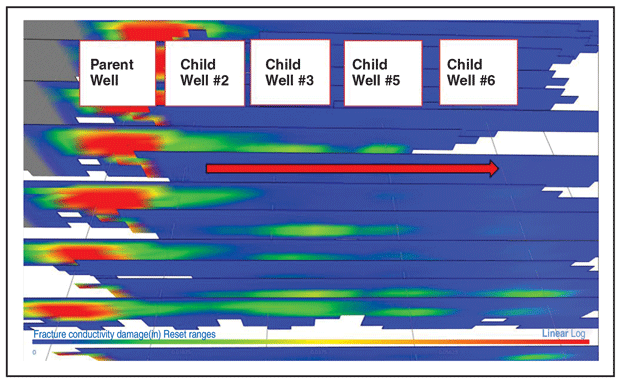
FIGURE 6
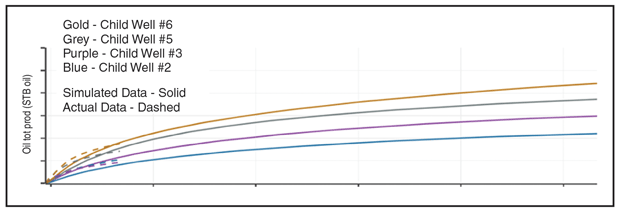
Child Well 30-Year Cumulative Oil Production
It was theorized that child wells were not only causing parent well damage, but also themselves were experiencing some conductivity damage related to their proximity to the parent. To identify how much damage was taking place, and to understand the effects of well spacing, a simulation without damage was run to understand the theoretical upper limits of the child well production.
The layout of the wells gives a clue as to why child wells 2 and 3 were producing less than child wells 5 and 6. Child wells 2 and 3 were fractured nearly a month before wells 5 and 6, but all the wells were placed on production at the same time. As child wells 2 and 3 sat, the fluid within the fractures began to mix with the matrix fluid, allowing hydrocarbons to seep into the fractures and spread laterally and vertically. Additional damaging frac fluid from child wells 5 and 6 were also transferred to child wells 2 and 3.
By using the exact same damage mechanism used to degrade the production on the parent well, which included a potency to control the magnitude of the reaction, a reaction rate to control the timing of the reaction and making the reaction proportional to the amount of hydrocarbons that are in the fracture, the damage was limited to the wells that had the greatest amount hydrocarbon interchange into the fracture: child nos. 2 and 3. To match the observations, the rate constant and potency of the damage reaction had to be calibrated.
Figure 5 shows the extent of the fracture conductivity damage for both the parent and child wells. The two child wells nearest the parent that experienced FDIs from subsequent child wells and sat the longest had the most damage. The increased damage closer to the parent impeded short-term and long-term production. Figure 6 shows the final calibration of child well oil production. Although not presented, chemical treatments on child wells 2 and 3 showed significant uplift in production post-treatment, confirming the presence of conductivity damage.
Editor’s Note: The preceding is the second of a two-part presentation on a comprehensive modeling study of complex parent-child well interactions in a five-well pad in the STACK play. Part I appeared in AOGR’s September issue.
DAVE RATCLIFF joined ResFrac in 2019 as the company’s first completions and reservoir engineer and its fifth employee. He has nearly 28 years of oil and gas experience in a variety of disciplines. Before joining ResFrac, Ratcliff spent 10 years working as a petrophysicist and petrophysics department manager for both Forest Oil and QEP Resources. Additionally, he spent 13 years with Schlumberger Wireline in various field, management and design roles. Ratcliff holds a B.S. in mechanical engineering from the University of Texas at Austin.
MARK MCCLURE is co-founder and chief executive officer of ResFrac. Before founding ResFrac in 2015, McClure was an assistant professor at the University of Texas at Austin in the department of petroleum and geosystems engineering. He serves on a number of scientific and academic boards and committees, and as an adjunct professor at Stanford University. McClure holds a B.S. in chemical engineering, an M.S. in petroleum engineering, and a Ph.D. in energy resources engineering from Stanford University.
GARRETT FOWLER is chief operating officer of ResFrac Corp. in Palo Alto, Ca. Prior to joining ResFrac as vice president of operations, Fowler was principal reservoir engineer at Tachyus Corp., where he worked with national oil companies, supermajors, and independents on deploying data science solutions. Before that, he was a reservoir engineer for Occidental Petroleum specializing in waterflood surveillance, piloting, and optimization. Fowler holds a B.S. in energy resources engineering and an M.S. in petroleum engineering from Stanford University.
BRENDAN ELLIOTT is a completions engineer in the drilling and completion technology group at Devon Energy. Primarily focused on complex development planning, modeling and fracture diagnostics, Elliott supports the Delaware Basin and Devon’s other major operated areas. Elliott has a B.S. from Texas A&M University, an M.S. in petroleum engineering from the University of Texas at Austin, and is currently a Ph.D. candidate in petroleum engineering at UT Austin.
AUSTIN QUALLS is a reservoir engineer in Devon Energy’s Delaware Basin business unit. At the time of the five-well STACK pad modeling study, he was working in the Anadarko Basin with a focus on future development planning in the STACK play. Qualls has a B.S. in petroleum engineering from the University of Oklahoma.
For other great articles about exploration, drilling, completions and production, subscribe to The American Oil & Gas Reporter and bookmark www.aogr.com.