


Pressure Data Optimizes Completions
By Larrez Green, Laine Valle, Qin Ji, Allie Garcia and Erica Coenen
HOUSTON–The Permian Basin Wolfcamp play has reached the point where operators are drilling and completing more infill than primary wells, and stimulation designs have become steadily more aggressive across the basin with higher fluid and proppant volumes. Yet, infill wells are consistently underperforming, compared with the production from primary wells, heightening concerns about the effects of interwell pressure interactions and fracture hits.
Companies are using various operational techniques to mitigate the impact of infill completions on parents, including a new approach that uses pressure-based fracture mapping to understand and control parent-child well interactions. The technology gives operators real-time insights on which to base decisions while pumping stimulation treatments to prevent fracture communication and to maximize the performance of every well on a pad.
Real-time pressure monitoring provides immediate, accurate feedback during stimulation using high-resolution surface or downhole pressure gauges at either parent or child well locations. Data drives decisions made to optimize frac design and pump schedules (slurry rate, slurry volume, proppant volume, diversion, etc.) during treatment. The ability to understand fracture growth behavior more comprehensively in real time enhances child-well production while protecting parent wellbores.
Pressure data signals are characterized based on poromechanical principles involving stress and fluid pressure fields surrounding a growing hydraulic fracture in a rock volume. As frac fluid is injected into the formation, two main stress regions–tensile and compressive–develop around the created fracture.
Tensile stress is formed at the fracture tip. Stress in this region increases until it reaches a critical minimum, causing the fluid to push the rock open and propagate the fracture. The opening of the fracture face results in an hourglass-shaped compressive stress region perpendicular to the fracture azimuth. Each fracture generates unique stress regions depending on fracture geometry and net pressure.
Reeves County Application
Pressure-based fracture mapping was used on a three-child well pad (AC2H, AC3H, AC4H) in the Delaware Basin in Reeves County, Tx., in conjunction with observations from the primary producer (AP1H). The goal of the project was to protect the parent well while optimizing the completion design of the child wells.
The three child wells were situated in a “wine rack” configuration in the Upper and Lower Wolfcamp B. The AC3H was landed in Upper Wolfcamp B, while the AC2H and AC4H were landed in the Lower B. The AC3H is 200 feet above the AC2H and AC4H, and has horizontal offsets of 400 and 600 feet, respectively.
The parent well is completed in the Wolfcamp A. It is directly above the AC2H, the westernmost child well, at a vertical offset of 400 feet. AP1H had been producing for 14 months before it was shut in and preloaded with 500 barrels of fluid (representing the approximate casing volume) before the child wells were stimulated. Cumulative oil, gas and water production was 226,000 barrels, 569 million cubic feet and 959,000 barrels, respectively.
Surface gauges were installed at the parent and all three child wells, and temperature-compensated pressure data was streamed in real time at 0.1 psi resolution and a 1.0 hertz sampling rate. Data streaming allowed each stage to be analyzed immediately after it was finished for on-the-fly completion design changes. The parent well had 55 stages with 10 clusters per stage spaced 110 feet apart. The child wells have 150-foot stage spacing and 10 clusters per stage.
In the initial child well completion design, fluid amounts and proppant concentrations were to be the same for all three wells (9,000 barrels of slickwater, 82,000 pounds of 40/70 white sand and 330,000 pounds of 100-mesh sand per stage). The only design difference between the wells was the pump rate. Because the AC2H and AC3H are closer to the parent well, they had a designed pump rate of 80 barrels/minute versus 100 bbl/m for AC4H.
Pressure communication on this pad was very strong between the Wolfcamp A and B. The combination of tensile and fluid communication signals indicated significant height growth upward in a vertically stacked pair of wells (AC2H and AC3H). The order of operations impacted the fracture growth of all three child wells.
Leading the zipper treatment sequence with the lower wells resulted in greater fracture height growth toward the parent well and shorter half-lengths in both of the nearest child wells. Leading with the upper well mitigated parent-child well communication, and all three child wells experienced greater horizontal fracture growth and less total height. With real-time feedback, the operator optimized the completion design, limited overlap between the developed fractures, and mitigated damage to both parent and child wells.
Surface Pressure Data
Surface pressure on the parent well, AP1H, increased 600 psi while the three child wells were being completed. The largest pressure signal magnitude within a stage was 400 psi (AC2H stage 6 and AC3H stage 27).
FIGURE 1
Surface Pressure Signal Magnitudes and Characteristics from AP1H
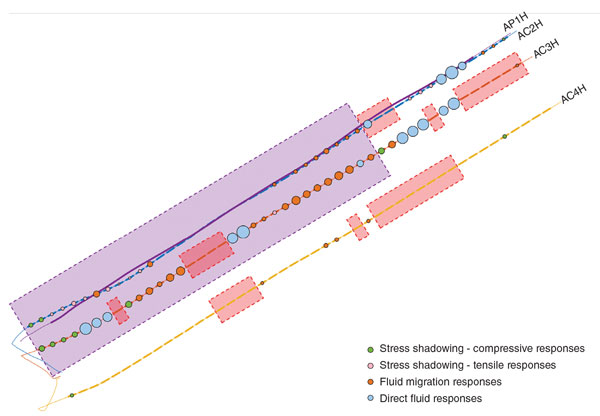
The colored circles in Figure 1 indicate the classification of the pressure signals observed from AP1H while each stage of the child wells was being fractured. The radius of the circle is proportional to the logarithmic pressure change magnitude recorded at each stage. The red boxes denote the stages not included in the analysis, including the loss of 16 total stages of pressure signals (AC2H stages 11-13, AC3H stages 2-6 and AC4H stages 10-17) related to pulling an electrical submersible pump from AP1H.
The poroelastic signal responses were divided as either compression signal (positive) or tensile (negative) pressure, and the recorded data was binned into four categories according to the nature of the parent-child pressure communication, ranging from severe to null:
- Direct communication (fluid moving through a hydraulic channel connecting the child and parent), which creates an instantaneous pressure increase and a significant pressure buildup trend, followed by pressure leak-off at the end of the stage;
- Fluid migration, identified by a smooth and gradual pressure increase during treatment that continues into the shut-in period before eventually decreasing as excess pore pressure dissipates into the reservoir and fracture system;
- Stress shadowing (poroelastic response), characterized by compressive stress increasing proportionally with respect to the dominant hydraulic fracture in the child treatment stage and immediate elastic spring-back “shadowing” at the end of the stage; and
- No observable signal, which can be caused by a large horizontal distance between wells, complete pressure isolation between benches or understimulation.
The surface pressure signal magnitudes observed at AP1H while fracturing the child wells were much greater for AC2H and AC3H than were those of AC4H. All signals for AC4H were less than 6 psi, likely attributable to the 500-foot vertical offset and 1,000-foot horizontal offset from the parent well. AC3H had a greater average signal magnitude than did AC2H because of different vertical and horizontal offsets, fracture sequence stress barriers and varying pump rates.
The original fracturing sequence plan called for keeping AC2H treated ahead of AC3H so that stress created by AC2H would act as a vertical barrier to mitigate communication between AP1H and AC3H. After AC3H stage 1 (first pressure-based fracture map monitor stage) was completed, AC2H and AC4H were to start two-well zipper operations.
In the first 13 stages, AC2H was, in fact, treated before AC3H. No communication was observed at the parent well from AC2H through the first four stages. However, pressure data began indicating direct fluid communication beginning with stage 5.
Figure 2 shows pressure signals from AP1H while fracturing AC2H stages 5-10. Black represents treatment pressure, red is slurry pump rate, green is downhole proppant concentration, and purple is pressure changes recorded from AP1H. On the purple line, the red segment indicates the interval containing the fastest pressure increase over one minute, while bright green indicates the fastest pressure increase over 10 minutes.
Direct Fluid Communication
The A, B and C panels in Figure 2 illustrate direct fluid communication signals present in each of the five stages in AC2H. These are exhibited by rapid pressure increases with large signal magnitudes that dropped very soon after the pumps were stopped. The fast pressure increases in stages 5, 6 and 7 had magnitudes of 60, 400 and 200 psi, respectively. Moreover, pressure-out occurred at the end of stage 5.
FIGURE 2
AP1H Surface Pressure While Fracturing AC2H Stages 5-10
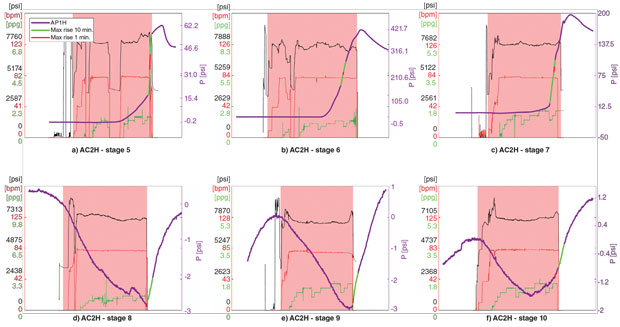
Panels D, E and F illustrate tensile poroelastic signals. Direct fluid communication and tensile signals indicated that the upper portions of the fractures in stages 5, 6 and 7 were interacting directly with parent well fractures. In stages 8, 9 and 10, the parent well only detected the tensile stress of the rock without fluid communication, resulting in pressure signal magnitudes of -3, -3 and -1.5 psi, respectively.
The vertical distances between AP1H and AC2H for stages 8, 9 and 10 are slightly greater than those between AC2H stages 5, 6 and 7 and AC1H. The differences in the vertical distance appeared to have a significant effect on the observed signal magnitudes and characteristics at AP1H. The downward growth of AP1H and upward growth of AC2H nearly matched their vertical separation in stages where tensile signals were observed, and overlapped the stages with direct communication.
This stage-by-stage pressure signal streaming allowed the operator to monitor the signals during each frac stage and proactively change the design. To mitigate the direct fluid communication between AP1H and AC2H and protect both wells, the operator made two significant design changes mid-completion:
- Decrease AC2H’s pump rate from 80 to 60 bbl/m beginning with stage 12; and
- Change the order of operations to lead with the AC3H instead of the AC2H.
After establishing the second pressure-based fracture map monitor in stage 13 of AC2H, AC3H was allowed to catch and pass AC2H, and it remained ahead throughout the remaining zipper operations with the objective of building a stress barrier to mitigate communication with AP1H.
The analysis shows that when AC2H (the deeper of the two wells and located directly below the parent) led in frac order, the induced stress field pushed the shallower AC3H to interact more with AP1H, but the parent still detected pressure changes from both child well fracs. When the shallower well led, it had more communication with the parent, and there was almost no communication between the deeper child and the parent.
The parent-well signal returned from stage 7 onward in AC3H. Direct communication signals were observed constantly until stage 12. However, when AC3H passed AC2H in the zipper order, the pressure magnitude dropped significantly at the parent well for both AC2H and AC3H. Only one direct communication response was observed from AC3H stages 13-26. All the other stages had less severe fluid migration and poroelastic responses.
Two direct communication responses were observed for AC3H stages 27 and 28 that may be attributed to local geologic features. The other three direct communication responses were observed for AC3H stages 40-42. They most likely can be attributed to lower vertical offset between AP1H and AC3H. By keeping AC3H ahead of AC2H, only one direct communication response was observed at AC2H stage 14. All the other signal magnitudes were below 11 psi.
Fracture Geometries
By changing the order of zipper frac sequencing between the two wells and decreasing AC2H’s pump rate on the fly, damaging frac hits were prevented from occurring on this pad. In addition, dominant hydraulic fracture geometries were resolved for each stage of the child wells using the surface pressure data collected.
Table 1 summarizes the averaged fracture half-lengths and heights for the trailing and leading stages of AC2H, AC3H and AC4H. It includes only the fracture half-lengths of the east side of AC2H and the west sides of AC3H and AC4H. The trailing and leading frac order indicate whether the fracture was developing in unperturbed or perturbed rock (increased stress from stress shadowing).
TABLE 1
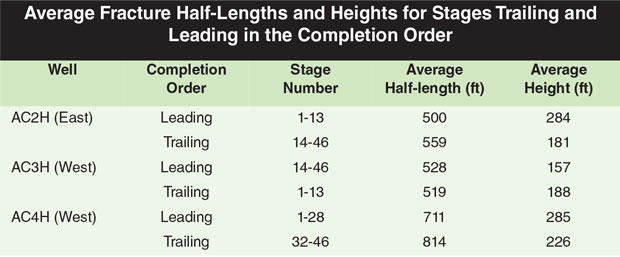
While stages 1-13 in AC2H were being completed, AC3H to the east had not yet been fractured, so AC2H was fracturing unperturbed rock. However, AC3H had been fractured before stages 14-46. Stress shadowing from the completed stages was present and the east side of the fractures of AC2H grew into perturbed rock.
The leading stages of AC2H had 57% larger heights and 10% smaller fracture half-lengths than those in trailing stages. Decreasing the pump rate from 80 to 60 bbl/m in the later stages also likely contributed to smaller fracture heights. AC4H showed the highest average fracture half-lengths of the three child wells, which may have been a result of its higher pump rate throughout the completion.
The leading stages of AC3H had 26% higher heights and 13% smaller fracture half-lengths than the trailing stages in the same well. Both AC2H and AC4H preferred to grow vertically when AC3H was not fractured previously.
For AC3H, the leading stages had 20% smaller heights and nearly the same fracture half-lengths than did the trailing stages. Comparing the AC3H in the Upper Wolfcamp B with the AC2H and AC4H in the Lower B reveals that the wells responded differently to the increased stress shadowing environments in which they were stimulated.
The gun-barrel plots in Figure 3 illustrate how fractures grew when AC3H was trailing or leading. The purple, blue, orange and yellow ovals represent the fracture geometries of all four wells.
FIGURE 3
AC3H Fracture Growth When Stressed (Left) and Unstressed (Right)
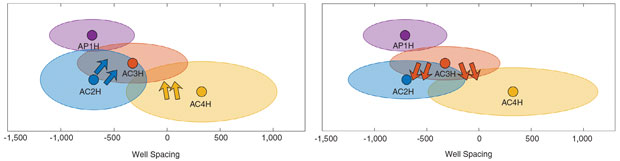
When AC3H was behind AC2H and AC4H (panel A at left), there was no stress barrier between AC2H and AP1H directly above it. The AC2H grew upward more toward the parent well when it was fractured in unperturbed conditions than when it had a stress barrier from the well diagonally above it. Without a stimulated well above, AC4H fractures were able to grow freely upward.
When fracturing began on the AC3H, the stress barrier in place from the newly fractured stages from AC2H below pushed the AC3H fractures upward toward the parent, promoting direct fluid communication signals from both AC2H and AC3H fracs recorded in the AP1H monitor gauge when AC2H led.
However, when AC3H led, the pressure impact to AP1H decreased in the absence of elevated stress from below. AC3H was able to grow downward, slightly away from parent well depletion, as illustrated in panel B at right in Figure 3. The orange arrows represent the stress direction when AC3H led. The vertical stress created by AC3H appeared to allow the lower wells to grow more in a horizontal direction.
This difference in final fracture geometry confirms that changing the order of operations can both mitigate the impact on the parent well and influence the shape of child-well fractures.
Editor’s Note: The preceding article is the first in a two-part feature on pressure-based fracture mapping. Part II appeared in AOGR’s September issue. For more information on the technology or case studies referenced, see SPE 199705, which was prepared for presentation at the Society of Petroleum Engineers 2020 Hydraulic Fracturing Technology Conference & Exhibition, held Feb. 4-6 in The Woodlands, Tx.

LARREZ GREEN is co-founder and executive vice president at MDC Texas Energy. Before joining MDC, Larrez served as chief executive officer of G6 Energy Services, a completions and production engineer with Cambrian Management LLC, an engineering and operations consultant for various operators, and a well service engineer for Schlumberger. Green holds a B.S. in civil engineering from Auburn University.

LAINE VALLE is the senior completions engineer at MDC Texas Energy. Before joining the company, Valle worked as the lead engineering consultant for companies in Howard County, Tx., and as a reservoir engineer for Chevron and Endurance Resources. She has a B.S. in petroleum engineering from Colorado School of Mines.

QIN JI is a petroleum engineer at Reveal Energy Services. Prior to joining the company, she worked as a civil engineer at Bleyl Engineering. She is the author of a chapter in the textbook, “The Properties of Petroleum Fluids, 3rd Edition.” Ji holds an M.S. in civil engineering from the State University of New York at Buffalo and a Ph.D. in petroleum engineering from Texas A&M University.

ALLIE GARCIA is a technical sales manager at Reveal Energy Services. Before joining the company, she worked for nine years in completion and production engineering roles with a large independent, a major global E&P, a small private equity operator and then as an independent engineering consultant. She holds a B.S. in petroleum engineering and a master’s of energy business, both from the University of Tulsa.

ERICA COENEN is vice president of operations and chief scientist at Reveal Energy Services, where she leads the engineering team and drives innovation for integrated diagnostics. Before joining Reveal, Coenen worked in advanced manufacturing technology and nanotechnology. She has 12 years of experience in fracture mechanics and computational multiphysics. Coenen has authored more than 30 papers and holds several patents. She has an M.S. and a Ph.D. in mechanical engineering from Eindhoven University of Technology.
For other great articles about exploration, drilling, completions and production, subscribe to The American Oil & Gas Reporter and bookmark www.aogr.com.