


Pressure Data Tracks Fracture Growth
By Larrez Green, Laine Valle, Qin Ji, Allie Garcia and Erica Coenen
HOUSTON–Real-time pressure monitoring during hydraulic fracturing provides critical insights to allow operators to optimize frac designs, modify pump schedules on the fly, prevent fracture communication and maximize the performance of each stage pumped in every well on a pad.
High-resolution pressure data is recorded by surface or downhole gauges at both parent and child well locations while completing the child wells. The pressure signals can provide operators the information needed to understand the characteristics and behaviors of created fractures, increase cluster efficiency, and control parent-child well interactions to protect parent wells from frac hits while improving child well productivity.
Pressure-based fracture mapping was used in a nine-well project in the Delaware Basin to anticipate and mitigate damage to two parent (BP1H and BP2H) and seven child (BC1H-BC7H) wells while completing a new pad. All wells are landed in the Wolfcamp A, except for the BP2H, which is in the Wolfcamp B and is drilled in a 22 degree counterclockwise rotation with respect to the other wells. Wells BC3H, BC4H and BC5H are toe up. The others are all toe down. Horizontal well spacing is 500 feet between all child wells.
BP1H had been on production for three months before child well completion operations began. The well had cumulatively produced 58,000 barrels of oil, 274 million cubic feet of natural gas, and 259,000 barrels of water from 65 stages completed with 120-foot spacing and 10 clusters per stage. BP2H had been on production for four years. It was not shut in during child well fracturing. Its cumulative oil, gas and water production was 399,000 barrels, 1.78 billion cubic feet, and 2.15 million barrels, respectively, from 38 stages completed at 170-foot spacing with three clusters per stage.
The child wells were stimulated in two phases, with wells BC4H, BC5H, BC6H and BC7H in the first phase and wells BC1H, BC2H and BC3H completed one month later during the second phase. For all seven child wells, stage spacing was 150 feet with 10 clusters per stage. The stage numbers varied according to well length.
Surface pressure gauges were installed on BP1H throughout all seven child completions and used intermittently during zipper frac operations. Data was streamed in real time so that signal magnitudes and characteristics could be analyzed and each stage’s pressure behavior could be monitored as fracturing operations progressed.
Surface Pressure Responses
Because of the distance between BP1H and the stages in BC1H, BC2H and BC3H, surface pressure signal responses observed from BP1H were from BC1H and BC2H only. Surface pressure at the parent well increased approximately 500 psi while completing BC1H and BC2H, and no response was observed during any of BC3H’s stages.
Poroelastic signal responses were classified as either compression or tensile pressure, and the recorded data was binned into four categories according to the nature of the parent-child pressure communication, ranging from severe to null:
- Direct communication, which creates an instantaneous pressure increase and a significant pressure buildup trend followed by pressure leak-off at the end of the stage;
- Fluid migration, identified by a gradual pressure increase during treatment and the following shut-in period, followed by gradual decrease as excess pore-pressure dissipates into the reservoir and fracture system;
- Stress shadowing (poroelastic response), characterized by tensile and/or compressive pressure changes resulting from progressive growth of the dominant hydraulic fracture in the child treatment stage and an immediate elastic spring-back “shadow” at the end of the stage; and
- No observable signal, which can be the result of a large horizontal distance between wells, but also can indicate complete pressure isolation between benches or an understimulated stage.
Figure 1A shows the signals as classified from the child wells received at BP1H while fracturing BC1H and BC2H. Only three poroelastic responses were observed. The remaining signals were either fluid migration or direct communication. The lack of poroelastic responses, and the consistency of fluid migration and direct fluid communication, indicated that fluid from the nearby child wells was moving toward the parent well, even with a far-field diverter applied as part of the completion design.
FIGURE 1A
Surface Pressure Signal Magnitudes and Characteristics from BP1H
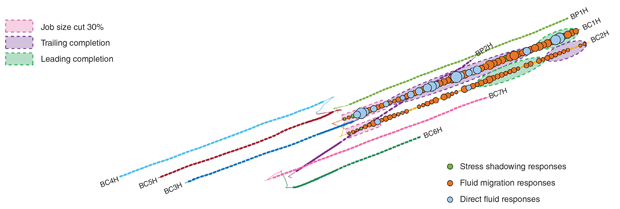
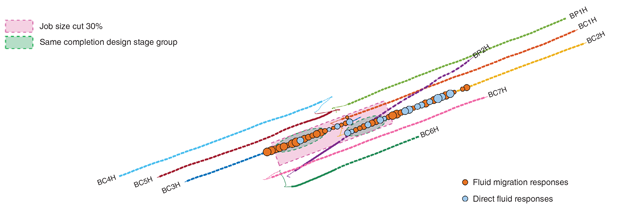
FIGURE 1B
Surface Pressure Signal Magnitudes and Characteristics from BC7H After Drill-Out
The fracture network in the reservoir was completely full of fluid because of all the fractures being created in the same area. Therefore, almost no pressure signals were exclusively driven by rock compression (poroelastic response). Almost all parent well communication was influenced by the fluid being pushed around by completion pressures interacting with this fracture network.
Fracture Sequences
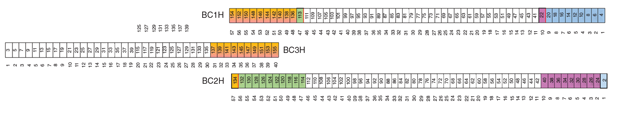
Given the results, the operator wanted to test whether the fracture sequence and the controllable stress barrier conditions could significantly impact the communication between BP1H and BC1H. The steps for the fracture sequences and data acquisition plan for BC1H, BC2H and BC3H were (Figure 2):
- Establishing the first pressure-based fracture map monitor (surface pressure gauge) after fracturing BC2H stage 1, then two-well zippering between BC3H and BC1H until BC1H stage 10. The toe of BC2H monitored the toe portion of BC1H (blue in Figure 2).
- Establishing the second pressure-based fracture map monitor on the BC1H after fracturing stage 10, then two-well zippering BC2H and BC3H until BC2H stage 10. The BC1H monitored the toe portion of BC2H (pink).
- Beginning the two-well zipper frac between BC1H and BC2H until BC1H stage 47 (no monitoring occurred for the mid-lateral area of BC1H and BC2H).
- Establishing the third pressure-based fracture map monitor on BC1H after fracturing stage 47, then two-well zippering between BC3H and BC2H until BC2H stage 58. The monitor on BC1H observed the heel portion of BC2H (green).
- Establishing the fourth pressure-based fracture map monitor on BC2H after fracturing stage 58, then two-well zippering between BC3H and BC1H until finishing the pad. This monitor observed the heel portions of both BC1H and BC3H (gold).
FIGURE 2
Data Acquistion Plan and Fracture Sequence for BC1H, BC2H and BC3H
Trailing and leading stage completion impacts stress barrier conditions and can affect hydraulic fracture growth, so it is important to consider this distinction in an analysis. Figure 1A depicts the groups of trailing (green shading) and leading (purple shading) stages with the same completion design. For both BC1H and BC2H, the signal magnitudes and characteristics are very similar for leading and trailing stages. Stress barrier condition did not appear to affect the type of pressure communication the parent well observed in this case.
The heel stages of BC1H, BC2H and BC3H are very close to one another. The operator was concerned about overstimulating the heel stages of the pad, which potentially could damage the parent well. Real-time monitoring revealed that for BC1H stages 25-46, more than half the signals were direct communication signals. More importantly, these fractures were getting too close together and interfering with one another. The BP2H is 500 feet below BC2H at the heel. Without shutting-in or repressuring it, it was expected that BP2H would act as a pressure sink.
However, Figure 1A shows that the stages of BC1H immediately above the BP2H are three consecutive direct communication signals with a signal magnitude greater than the rest of the stages. Even with the parent well’s depletion zone located directly below the BC1H, frac fluid from BC1H still flowed preferentially toward BP1H in the same bench, rather than the BP2H directly below.
Mitigation Measures
After observing these direct communication signals with BP1H in the early stages of BC1H, the operator chose to implement measures to mitigate communication between these two wells. First, the pump rate of all child wells was decreased to 60 bbl/m starting with stage 20 in BC3H. After no immediate pressure communication improvement was observed in subsequent stages, job size was reduced by 30% the following day, starting with stage 50 in well BC2H. The pressure data indicated that lowering the pump rate and decreasing the job size successfully mitigated the parent-child well communication in the heel area.
Figure 1B shows surface pressure signal magnitudes and characteristics of each stage from monitor BC7H after drill-out. The pink box highlights the stages of BC2H and BC3H with the lower pump rate and smaller job size. Because of the local azimuth, the BC2H may have blocked pressure signals from the heel stages of the BC3H from reaching the parent well. For this reason, the stages in the green shaded area were selected to compare with one another; they all have the same completion design (pump rate, proppant concentration and amount, and fluid volume).
With almost double the distance to the BC7H and the same completion design, the BC3H stage group had much larger average and maximum signal magnitudes than BC2H. This was possibly caused by the pressure sink effect of the BP2H on the BC2H. Even though the BP2H is 500 feet beneath the BC2H, the signal observed at BC7H from the BC2H still may have been dampened by this drainage. The BC3H is 500 feet farther horizontally from BC7H, but its signal magnitude was still much stronger than that of the BC2H. Thus, the heel area depletion of the deeper BP2H appeared to have had significant impact on the pressure behavior of the nearest child wells.
Fracture Geometries
In addition to optimizing fracturing operations by monitoring the impact of parent well depletion on the new child well completions, pressure-based fracture mapping was used to characterize the dominant hydraulic fracture geometries for the four monitored stage groups of the child wells.
The relative location of the child wells and the pressure-based fracture map monitors allowed for resolving fracture geometries for the heel stages of BC3H. The heel stages of BC1H and BC3H had very similar fracture geometries, though they are much smaller compared with the fracture geometries resolved at the toe stages of BC1H. The fracture geometries of the heel stages of BC2H also are smaller than its toe stages, but the difference is much smaller than that between the BC1H toe and heel. These differences indicate that decreasing the pump rate and job size reduced the fracture geometry. On this pad, the impact of changing the completion design on BC1H was more significant than to BC2H.
Fracture geometries of BC1H toe stages are slightly larger than in the BC2H toe stages. The BC1H east side fractures grew into unperturbed rock while BC2H west side fractures grew into recently completed rock. BC2H heel stages have larger geometries than BC1H and BC3H heel stages for two reasons. First, the heel stages of BC2H led completions compared with the BC1H and BC3H, which meant the rock was unperturbed for BC2H and had stress barriers influencing BC1H and BC3H fracture growth.
Second, BP2H is located right beneath the heel stages of BC2H. The heel area of BC2H had lower local in situ stress initially because of the depletion of the lower parent well, so those fractures were more likely to grow into a single dominant fracture per stage, resulting in larger geometries.
The pressure-based fracture maps also were used to investigate how volume pumped influenced fracture growth. In most of the toe stages, dominant fractures grew more linearly through the end of the stages, as illustrated in Figure 3.
FIGURE 3
Heel and Toe Stage Group Fracture Growth Curves for BC1H, BC2H and BC3H
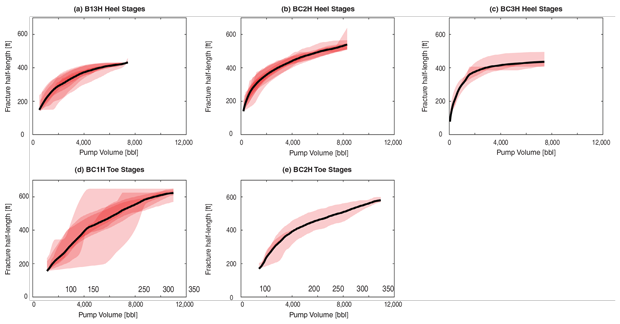
For the heel stages of BC1H and BC3H, the rollover of the growth curves occurred when ±3,000 barrels of fluid were pumped. The dominant fracture slowed or stopped growing after pumping 3,000 barrels, and fracture complexity continued developing through the rest of these stages as the remaining fluid was injected. The black line in each graph represents the average growth curve for the stage group. The regions of darker red shading in the plots indicate where a higher density of individual growth curves fall within each group.
The growth curves of the heel and toe stages of the BC2H did not roll over. Lower pump rates yield a lower net pressure, and with reduced net pressure, a smaller stress intensity occurs at the fracture tip. With less stress intensity at the fracture tip, a smaller ultimate fracture half-length is likely. In the heel stages, which are closer to the parent well depletion, this difference in geometry is likely related to the lower stress field of the depleted area around BP2H.
Editor’s Note: The preceding article is the second in a two-part feature on pressure-based fracture mapping. Part I appeared in AOGR’s August issue. For more information on the technology or case studies referenced, see SPE 199705, which was originally prepared for presentation at the Society of Petroleum Engineers’ 2020 Hydraulic Fracturing Technology Conference & Exhibition, held Feb. 4-6 in in The Woodlands, Tx.

Larrez Green is co-founder and executive vice president at MDC Texas Energy. Before joining MDC, Larrez served as chief executive officer of G6 Energy Services, a completions and production engineer with Cambrian Management LLC, an engineering and operations consultant for various operators, and a well service engineer for Schlumberger. Green holds a B.S. in civil engineering from Auburn University.

Laine Valle is the senior completions engineer at MDC Texas Energy. Before joining the company, Valle worked as the lead engineering consultant for companies in Howard County, Tx., and as a reservoir engineer for Chevron and Endurance Resources. She has a B.S. in petroleum engineering from Colorado School of Mines.

Qin Ji is a petroleum engineer at Reveal Energy Services. Prior to joining the company, she worked as a civil engineer at Bleyl Engineering. She is the author of a chapter in the textbook, “The Properties of Petroleum Fluids, 3rd Edition.” Ji holds an M.S. in civil engineering from the State University of New York at Buffalo and a Ph.D. in petroleum engineering from Texas A&M University.

Allie Garcia is a technical sales manager at Reveal Energy Services. Before joining the company, she worked for nine years in completion and production engineering roles with a large independent, a major global E&P, a small private equity operator and then as an independent engineering consultant. She holds a B.S. in petroleum engineering and a master’s of energy business, both from the University of Tulsa.

Erica Coenen is vice president of operations and chief scientist at Reveal Energy Services, where she leads the engineering team and drives innovation for integrated diagnostics. Before joining Reveal, Coenen worked in advanced manufacturing technology and nanotechnology. She has 12 years of experience in fracture mechanics and computational multiphysics. Coenen has authored more than 30 papers and holds several patents. She has an M.S. and a Ph.D. in mechanical engineering from Eindhoven University of Technology.
For other great articles about exploration, drilling, completions and production, subscribe to The American Oil & Gas Reporter and bookmark www.aogr.com.