


Resource Science
DNA-Based Diagnosis Of STACK Completions Optimizes Well Performance
By CharLee Mallory, Jake Huchton, Jordan Sawadogo and Matthew Haggerty
OKLAHOMA CITY–The STACK play contains a prolific petroleum system with multiple stacked targets, but development challenges are underpinned by fieldwide geological heterogeneities, including variable reservoir quality and the presence of natural fractures and dense laminations. Given the geologic complexities, replicating completion designs from partial-section pilots and offset wells may not necessarily be the best choice for optimizing well performance in full-section development programs.
As it began its first full-section STACK development in Canadian County, Ok., Chaparral Energy undertook a study to assess the impact of interwell spacing, targeting, completion order, wine-rack configurations and other completion design variables on well performance. Based on insights from offset pilots, the study tested four benches across 11 wells with variable spacing and targeting. A single hydraulic fracturing design was used for like targets, including four wells in the Upper Meramec, three in the Sycamore, and two each in the Lower Meramec and Woodford.
The study utilized an advanced data acquisition program that included downhole pressure gauges, chemical tracers and DNA-based diagnostics to assess well performance. DNA diagnostics technology is capable of accelerating insights across full-section development by helping operators understand fluid contributions from multiple producing zones. It played a key role in assessing and monitoring the duration of interwell communication between offsets, and in measuring the relative contribution from multiple strata between landing zones.
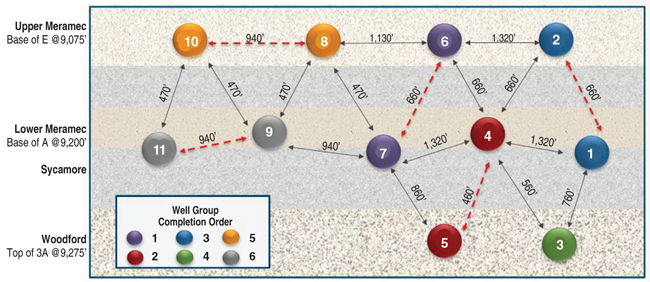
Spacing tests from offset pilots five miles away were applied on the eastern portion of the section. The central and western pads were downspaced relative to the eastern pad, with lateral and vertical spacing lowest to the west. Completion order varied from east to west across the section. The eastern and center pads were interbench zippered with codevelopment of the Woodford. The western pad was intrabench zippering with no Woodford development. A comprehensive gun barrel view of the full section is pictured in Figure 1. Wells are colored by completion order. Red dashed lines denote a zipper pair. Lateral and vertical well spacing increase across the section west to east.
FIGURE 1
Full Section Gun-Barrel View
The 11 wells in the section had an average lateral length of 4,936 feet and averaged 26 frac stages. They averaged 2,175 pounds of proppant and 1,738 gallons of fluid per foot at a rate of 100 barrels/minute. That compares with an average lateral length of 4,558 feet for the 10 analyzed offset wells. The offsets averaged 24 stages per lateral with 2,334 pounds of proppant and 2,289 gallons of fluid per foot pumped at 90 barrels/minute.
Production differences were evaluated by examining the impact of well spacing/targeting, completion design and interwell communication on well performance. Although previous offset pilot pads had been developed with similar spacing and completion parameters, there were significant differences between average production profiles, with higher initial production over 180 days observed in the full-section wells.
The results demonstrated that completion design and interwell communication impacted full-section well performance in three notable ways:
- Interbench codevelopment significantly increased communication across perceived deterrents to fracture growth.
- Well-to-well communication was influenced by completion order.
- Aggregate interwell communication was higher in full-section development than in pilot pads, which may have contributed to the full section initially outperforming predrill expectations.
The differences in well performance and well-to-well connectivity carry important implications for operators planning to use partial spacing tests to develop multitarget full sections. Specifically, these observations underscore the potential for similar completion designs to yield materially different well performances in full-section pad development.
DNA Diagnostics
Subsurface DNA can be acquired from microbes in reservoir and nonreservoir rock. These microbes live and proliferate within primary- and secondary-porosity intervals, as well as within faults and fractures. Pore space distribution indicates that 20% of the upper, middle and lower members of the Woodford Shale have pore throats greater than 1 micrometer, which can be large enough to house microbes. The ubiquity of microbes in the subsurface makes them an excellent diagnostic tool, and microbial communities are sensitive to environmental pressures, chemical gradients, mineralogy and fluid properties. Over geologic time, even subtle differences can result in evolutionarily different species.
DNA diagnostics were performed by comparing DNA markers in produced fluids (“sinks”) with DNA markers along a cuttings (“sources”) baseline. The cuttings baseline was established by collecting wet well cuttings from the mud shakers every 15 feet of measured depth. After collection, cuttings immediately were placed in chilled coolers to minimize microbial growth from nonsubsurface sources and shipped overnight to the laboratory for DNA extraction, amplification and sequencing. Similarly, produced fluid samples were collected directly from the wellhead, placed in chilled coolers and overnighted to the lab for processing.
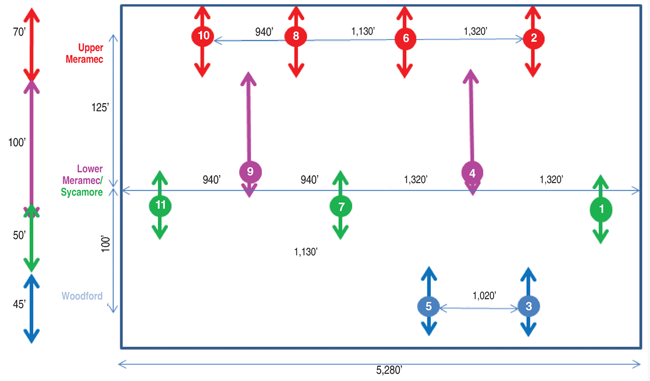
Total fluid contribution logs represent the probability that a given formation is contributing to production by analyzing the overlap of DNA markers found in produced fluids versus cuttings. Figure 2 shows modeled fracture heights across full-section targets for the 11 wells. The Meramec A and Sycamore targets have overlapping conductive areas. Wells 2, 6, 8 and 10 were landed in the Upper Meramec. Wells 1, 7 and 11 targeted the Sycamore. Wells 4 and 9 were landed in the Lower Meramec, and wells 3 and 5 were landed in the Woodford. Each Woodford well was codeveloped with an overlying Lower Meramec or Sycamore well (Well 4 was zipper-completed with a Woodford well).
FIGURE 2
Modeled Fracture Heights across Full Section Targets
Analysis of total fluid contribution logs from the wells landed in the Woodford, Lower Meramec and Sycamore demonstrated that interbench codevelopment significantly increased communication across perceived deterrents to fracture growth. Specifically, interbench fluid communication was observed in wells landed both above and below the Kinderhook high-stress zone overlying the Woodford.
Furthermore, these contributions persisted throughout the first six months of production, suggesting that a significant portion of connected fractures across the Kinderhook remained active conduits after large pressure drawdowns within the reservoirs. While communication from Woodford wells landed below the Kinderhook was within the predicted completion design outcomes, pilot tests from single-bench development underestimated interbench communication from Lower Meramec and Sycamore wells landed above the Kinderhook. Upward Communication
Total fluid contributions from Woodford wells 5 and 3 show clear communication from formations above the Kinderhook. Strong fluid contributions from the Woodford and Sycamore were observed in Well 5, while Well 3 displayed a broader contribution profile extending from the Woodford through Meramec B.
Figure 3 shows average fluid contributions from each well over six months along with the top five contributing individual DNA markers (right). Markers outside the top five are shaded light grey. Figure 4 shows the top five DNA markers in the produced fluids from each well along with the abundances of each marker found in the cuttings baseline (right). In Well 5, markers 4 and 5 (purple and pink) made up more than half the total signal in the fluid contribution log. Both markers are found in abundance in the middle section of the Sycamore. Marker 5 is also found in shallower reservoirs, but neither marker is found in any meaningful abundance in the Woodford.
FIGURE 3
Fluid Contributions in Woodford-Landed Wells
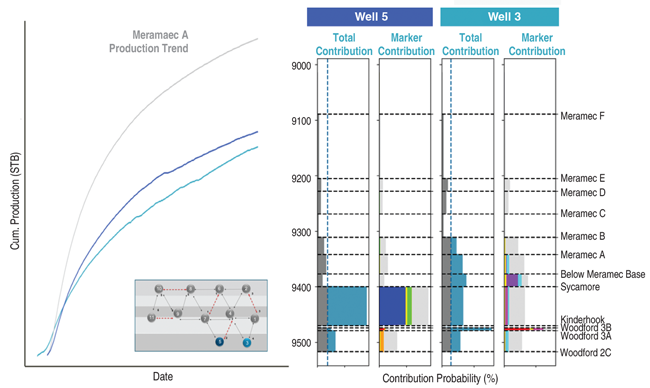
FIGURE 4
DNA Markers from Woodford-Landed Wells
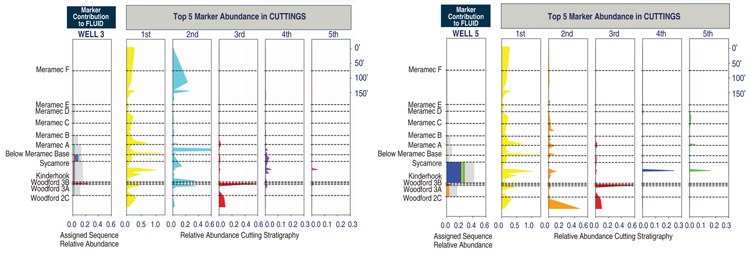
A similar conclusion for Well 3 is evident when looking at the abundances of markers 4 and 5 in the produced fluids and their distribution along the cuttings. The presence of non-Woodford associated markers in produced fluids and the strength of these markers’ contributions in the allocation model provide a compelling data point that upward fracture propagation from Woodford-landed wells was not limited by the Kinderhook.
Additional contributions seen in Well 3 from below the Meramec base and in Well 5 from the Sycamore are higher because of a few DNA features found at higher abundance in the rock cuttings from those formations, and are extremely rare or absent from the Woodford.
The strength and profile of fluid contributions indicate formation contributions above the Kinderhook, which are likely significant contributors to produced fluid volumes during early-time production for each well. Over the first six months of production, Well 5 slightly outperformed Well 3. Interestingly, Well 5 exhibited stronger contribution from the Sycamore.
The Sycamore is characterized as a primary landing zone thanks to an overall thicker section with higher effective porosity. It is possible that the stronger fluid contributions from the Sycamore represent improved stimulation of the formation from zipper completions of Well 5 with a Lower Meramec-landed well. If so, Well 5’s higher six-month cumulative production compared with Well 3 theoretically could be explained by larger Sycamore fluid contributions from enhanced stimulation.
The effective drainage heights of wells 5 and 3 computed from overlapping fluid-to-cuttings DNA markers and other diagnostics were 110 feet and 160 feet, respectively, above the landing zone at six months. These heights are larger than predicted from single-bench completion models, which were 35 feet for the Woodford wells. Based on single-bench completion models, neither Woodford well should have effectively stimulated overlaying reservoir above the Kinderhook.
Fluid contributions originating from above the Kinderhook were also consistent with interwell tracer data. Oil and water tracers from wells 5 and 3 were observed throughout the heel and middle lateral of offset wells landed as high as the Upper Meramec. A small degree of interwell tracer communication also was observed in the toe of the lateral between wells 5 and 3, and in Upper Meramec wells.
Integrating tracer profiles and DNA marker total fluid contribution suggests that fractures from Woodford wells extend into the Upper Meramec either through reactivating existing natural fractures or through connecting induced hydraulic fractures from overlying wells. Although connected fractures may extend to the Upper Meramec, this integration suggests the majority of communication occurs within the Sycamore, and to a lesser extent, within the Meramec B.
Downward Communication
Analysis of the five wells landed in the Sycamore/Lower Meramec shows fluid contributions from below the Kinderhook, with stronger Woodford contributions observed in the two wells codeveloped with Woodford targets. Figure 5 shows DNA contributions for Sycamore and Lower Meramec wells in single and codeveloped scenarios. Two of the five wells are unbounded (Sycamore landed wells 11 and 1), while the remaining wells (one Sycamore and two Lower Meramec) are at least partially bounded. Early-time pressure data during completion shows pressure interference between Sycamore-Woodford and Lower Meramec-Woodford wells. The contributions suggest that the communication observed from initial pressure interference responses persisted through the first six months of production.
FIGURE 5
Single versus Co-Development Total Fluid Contributions
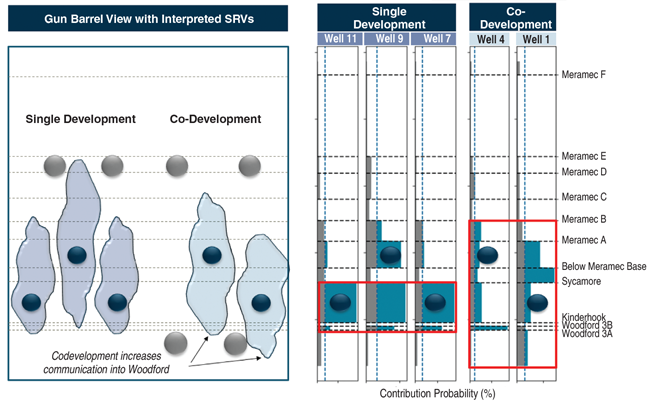
Downward communication was higher in codeveloped wells than single-developed wells, despite zippering codeveloped wells with shallower targets. This trend is most readily observed from the contrasting fluid profiles between wells 11 and 1. Whereas the fluid contributions from Well 11 were concentrated in the Sycamore, fluid contributions from Well 1 were more broadly distributed, with above-mean values observed in the Woodford through Meramec A. A similar pattern was observed between single-development and codevelopment Lower Meramec wells (9 and 4). For these wells, codevelopment appeared to result in broader contributions above and below the landing zone in Well 4, as well as stronger contributions from the Kinderhook.
Interestingly, single-bench development models for the Sycamore and Lower Meramec wells predicted a downward fracture height propagation of 20 feet for the Sycamore-landed wells and 10 feet for the Meramec-landed wells. Based on previous pilot studies, estimated fracture heights for the codeveloped Sycamore and Lower Meramec wells ranged between 75 and 125 feet. Drainage height estimates from total fluid contributions below the landing zone were 60-120 feet for the Lower Meramec and 50-100 feet for Sycamore wells.
Differences in anticipated fracture height versus observed drainage heights across the section could be driven by several factors. First, the study area has varying fluid and mechanical properties, and unevenly spaced natural fractures that make fracture design inherently complex. Second, offset well modeling may not have adequately captured the impact of stress shadowing on zipper completions. These limitations may have been compounded further by interbench zipper completions. Also, there is additional complexity from the hydraulically fractured and pressurized open fracture network. Induced unpropped fractures have been shown to propagate toward open fracture networks in zipper-fractured wells.
Completion Ordering
It should also be noted that completion order played a notable role in increasing interwell communication across the first three sets of completed wells. In the case of the first two wells (6 and 7) completed in the section, interbench zippering in the absence of any existing stress profile appeared to increase shared stimulated reservoir volumes. We hypothesize that hydraulic fracturing created a significant pressure wall that impacted subsequent completions, propagating fractures farther east than initially modeled.
Total fluid contributions from Well 6 indicate that zipper completions with a lower bench extended its SRV from the Upper Meramec to the Sycamore. While the contributions from the Sycamore were initially counterintuitive given modeling results, the strength and duration of the contributions ruled out the possibility that Sycamore formation fluids were a transient event.
Well 6 also had strong Upper Meramec fluid contributions. Fluid contributions in offset Upper Meramec wells are confined primarily to the Upper Meramec with weak contributions far from the landing zone. Offset wells also have steeper declines and smaller six-month cumulative production. The outperformance of Well 6 is consistent with strong contributions observed in the Sycamore, which are absent in the other two offset Upper Meramec wells.
The zippering of wells 6 with 7 (landed in the Sycamore) was the primary driver to extending Well 6’s SRV into the Sycamore. Higher communication between zipper-fractured wells may be related to commingled fracture networks created during rapid successive fracturing between two zippered wells. Since these wells were the first set of completions in the section, it is possible that, in the absence of pre-existing completions, zippering created sufficient stress shadowing that later-stage Well 6 fractures propagated toward open fracture networks of earlier stages in Well 7. If this interpretation is correct, interwell communication on future full-section development may be reduced by increasing the time between successive stage fracturing.
The extended SRV interpretation from total fluid analysis also is supported by interwell oil and water tracer data from Well 6, which indicates communication with wells landed in deeper targets, including noticeable water tracer concentrations apparent in Sycamore-landed Well 1 and Woodford-landed Well 5.
Two separate sets of DNA analysis indicate that Lower Meramec wells completed before Upper Meramec wells had increased interwell communication with offset wells. A fluid-to-fluid analysis (fluid allocation) across the section and DNA similarity (assesses biological similarities between samples) indicated higher interwell communication between wells 4 and 2 than between wells 9 and 8. Based on the trend lines, Well 4 appeared to be more similar to Upper Meramec-produced fluids than to Lower Meramec-produced fluids. The proximity between wells 4 and 2 on a DNA similarity map also indicated their fluids are more similar than those between wells 9 and 8. These observations are consistent with early-time tracer data.
It is hypothesized that the elevated level of interwell communication between wells 4 and 2 was driven by completing Well 4 immediately after wells 6 and 7. This rapid completion did not allow enough time for the pressure from the first two completions to dissipate before Well 4’s completion. This, in turn, created a pressure wall at the start of Well 4’s completion that drove fracture propagation eastward. Although completion order always has been an important factor in codevelopment, this finding led to even more emphasis on sequencing and zipper-pair selection.
Production Performance
During the first six months of production, the full section outperformed legacy type curves by an average of 23%. Intrabench zippering and a complex fracture network growth are thought to have enhanced stimulation greatly at and between landing zones throughout the section, driving improved performance during early well life. DNA diagnostics support this interpretation as every well had above-average fluid contributions outside of its landing zone during its first six months, suggesting some degree of conductivity along fractures far from the landing zone toward the wellbore.
Although the 11 wells still were outperforming legacy type curves after 12 months on line, their outperformance was diminished at six months as a result of higher declines than the type curve. The larger-than-expected initial SRVs and hydraulic communication across and within benches resulted in higher initial rates (and steeper declines). Faster rates of pressure drawdown across the section also may accelerate proppant crushing, embedment and fines migration, further reducing well performance after early-time production.
Integrating DNA diagnostics with production, pressure and tracer data demonstrated that completion order, targeting and interwell communication materially impacted well performance across the section. One of the study’s main outcomes has been to adjust completion order so that upper wells are completed before lower wells to minimize interwell communication. Completing upper wells first has been shown to create pressure walls limiting upward fracture growth from lower wells.
In addition, the study’s findings indicate that some benches can be developed with fewer wells per section and still attain proper drainage. Further development testing could help determine whether fracture half-lengths would have been longer without competing SRVs. The combination of wider interwell spacing and increased fracture half-lengths could result in an optimal economic outcome without sacrificing long-term recovery.
Finally, the presence of nonlanding zone associated markers in produced fluids, and their duration during the six-month monitoring period, suggests there is value in long-term fluid contribution monitoring to assess drained rock volumes. Understanding the differences between volumes that represent production acceleration and volumes that materially change recovery factors will have important implications for future infill drilling, active full-section development and enhanced oil recovery.
Editor’s Note: For more information on the DNA diagnostics results in the STACK play study, see SPE 201726, a technical paper originally prepared for publication at the Society of Petroleum Engineers’ 2020 Annual Technical Conference & Exhibition 2020. The preceding article was adapted from the paper. The authors acknowledge Whitney DeAngelis, a reservoir engineer at Chaparral Energy, and Courtney Price, a senior geologist at Chaparral Energy, for their contributions.
CHARLEE MALLORY is a senior operations engineer at Chaparral Energy. She has 10 years of industry experience, all of which is specific to the Mid-Continent region. Mallory’s primary focus has been completion design and diagnostics, as well as production enhancement. She holds a B.S. in chemical engineering from Oklahoma State University.
JAKE HUCHTON is production and completions engineering manager at Chaparral Energy. In addition to those functions, he is responsible for all associated field operations. Prior to joining Chaparral in 2018, Huchton served in a number of technical and operational roles at Linn Energy. He holds a B.S. in petroleum engineering from The University of Oklahoma.
JORDAN SAWADOGO is a principal reservoir engineer at Biota with project experience across multiple unconventional plays. Prior to joining Biota, he was a reservoir engineer at Quantum Reservoir Impact in the reservoir management and simulation group. Sawadogo has seven years of industry experience and holds an M.S. in reservoir engineering from Imperial College London.
MATTHEW HAGGERTY is a senior data scientist at Biota. His primary focus has been developing analytical tools to support DNA-based diagnostics. Prior to Biota, his work spanned DNA-based applications from exploratory environmental monitoring to personalized human medicine. Haggerty holds a degree in biology from San Diego State University and a Ph.D. in ecology from UC Davis.
For other great articles about exploration, drilling, completions and production, subscribe to The American Oil & Gas Reporter and bookmark www.aogr.com.