







Frac Spreads Must Stay Active To Meet Gas Demand
By Matt Johnson and Avik Bhanja Chowdhury
Today, any attempt to forecast drilling and completion activity or hydrocarbon production must account for the rapid rise of artificial intelligence.
As hyperscalers commit tens of billions of dollars to build massive data center campuses across the United States, they are racing each other to secure electricity. Individual facilities now require hundreds of megawatts of continuous power. The largest announced developments need almost as much electricity as major metropolitan areas.
Unlike traditional commercial or industrial loads, AI data centers operate around the clock, creating a continuous baseload requirement that fundamentally changes how electricity must be generated and delivered. Utilities will supply much of that power, but the scale and reliability requirements are already reshaping generation planning, transmission investment and fuel procurement.
For the upstream industry, which is already benefitting from the ongoing upsurge in LNG exports, data centers’ growth raises an important question: How much additional natural gas will be required to support the next wave of AI infrastructure?
Starting With Electricity
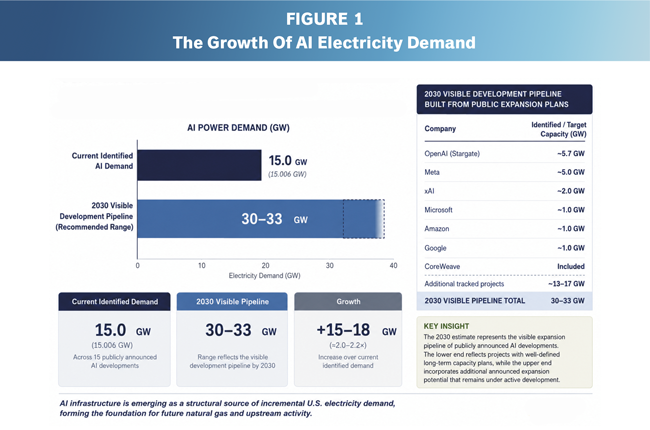
Primary Vision’s AI Power Demand Database currently tracks 15 publicly announced AI developments representing approximately 15.7 gigawatts of identified power demand. Based on that database, the visible U.S. AI development pipeline supports approximately 30-33 GW of potential electricity demand by 2030 (Figure 1). Our 30 GW midpoint reflects projects with sufficiently disclosed long-term expansion plans, while the upper end of the range captures additional announced developments and expansion potential that remain less fully defined.
Source: U.S. Energy Information Administration, Institute of Gas Technology, company disclosures
The database includes approximately 5.7 GW of identified demand associated with OpenAI-led developments, 5.0 GW for Meta, 2.0 GW for xAI, and approximately 1 GW each for Microsoft, Amazon and Google. These figures are based on publicly announced projects and expansion plans rather than speculative capacity assumptions. While individual projects will inevitably be delayed, resized or cancelled, new projects continue to enter the pipeline. The 33 GW scenario therefore represents a midpoint view of today’s visible development pipeline rather than an aggressive estimate of ultimate AI demand.
For the upstream industry, however, electricity demand is only the starting point. Oil and gas producers do not respond to megawatts; they respond to fuel demand. Understanding AI’s long-term impact therefore requires translating electricity consumption into natural gas demand using a consistent analytical framework.
From Electricity To Gas
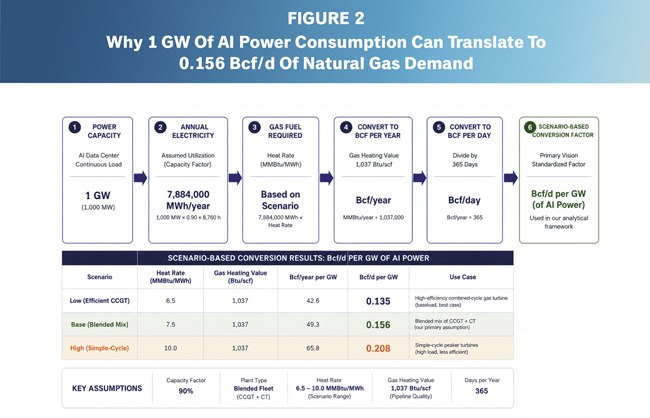
Electricity demand is measured in gigawatts, while upstream markets operate in billion cubic feet per day. Primary Vision bridges these two systems through a standardized engineering conversion that translates continuous AI electricity demand into equivalent natural gas consumption. The methodology converts installed power capacity into annual electricity generation using a 90% capacity factor, applies a heat-rate assumption to determine fuel requirements, and then converts those fuel requirements into Bcf/d using a pipeline-quality natural gas heating value of 1,037 Btu/scf.
The framework produces three engineering conversion factors based on generating efficiency. A high-efficiency combined-cycle gas turbine (CCGT) yields 0.135 Bcf/d per GW, a blended fleet of combined-cycle and combustion turbines produces 0.156 Bcf/d per GW and serves as our base case, while a simple-cycle combustion turbine requires 0.208 Bcf/d per GW (Figure 2).
The framework is designed for scenario analysis rather than forecasting the future generation mix. As AI infrastructure expands, natural gas demand can be evaluated consistently under different gas participation assumptions, creating a direct analytical link between AI power demand and upstream natural gas markets.
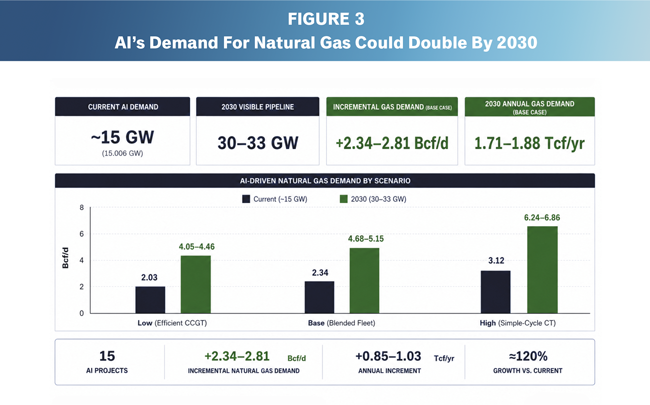
Applying the framework to the AI Power Demand Database suggests AI could become a meaningful new source of structural natural gas demand. Based on the visible 2030 development pipeline of approximately 30-33 GW, implied natural gas demand ranges from 4.05-4.46 Bcf/d under the Low (efficient CCGT) scenario, 4.68-5.15 Bcf/d under the Base (blended fleet) scenario, and 6.24-6.86 Bcf/d under the High (simple-cycle) scenario (Figure 3).
The analysis assumes AI load is fully served by natural gas generation and brackets only differences in generating efficiency. Lower natural gas participation would reduce these estimates proportionally. It demonstrates that AI demand remains material across every generation portfolio. The primary uncertainty is the efficiency of the generating fleet used to serve that demand. Higher-efficiency combined-cycle plants consume less natural gas per unit of electricity than simple-cycle combustion turbines.
Source: Primary Vision AI Activity Database, U.S. Energy Information Administration, company disclosures
It’s worth reiterating that unlike seasonal demand or short-term market cycles, AI infrastructure represents a continuous industrial load with operating lives measured in decades, making it a durable source of incremental natural gas demand.
Plays That Will Benefit
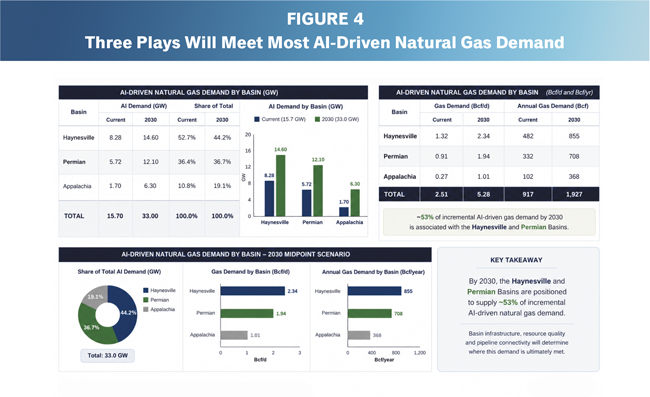
Under Primary Vision’s allocation framework, the Haynesville and Permian account for the largest share of incremental AI-related gas demand (Figure 4). The Haynesville is expected to capture the largest share of that demand because it is a dry-gas basin with abundant reserves. It helps that the play has direct access to Gulf Coast pipeline networks and is close to the fastest-growing LNG export corridor, which means operators there would have strong incentives to increase activity even without the substantial demand boost from data centers.
The Permian should capture roughly 36-37% of incremental demand, supported by abundant associated gas production and expanding takeaway capacity that position the basin to serve multiple sources of growing demand across the United States.
Source: Primary Vision AI Activity Database, EIA, company disclosures
Appalachia is also well-positioned to contribute incremental supply to AI-driven demand. It remains one of North America’s largest and lowest-cost natural gas resource bases. While pipeline constraints have limited production growth in recent years, the basin retains significant reserve capacity and existing production infrastructure.
By our estimates, the Haynesville and Permian account for approximately 81% of AI-driven natural gas demand under the 2030 visible development pipeline, equivalent to approximately 3.9-4.3 Bcf/d (or roughly 1.4-1.6 Tcf/year) of incremental natural gas demand under the blended-fleet scenario. The Haynesville contributes approximately 2.1-2.3 Bcf/d, followed by the Permian at approximately 1.8-1.9 Bcf/d, while Appalachia contributes roughly 0.9-1.0 Bcf/d.
The concentration of demand highlights that AI is unlikely to create a uniform uplift across the U.S. gas market. Instead, the greatest opportunity lies in basins with the reserves, takeaway capacity and infrastructure needed to support long-term production growth.
Implications For Frac Activity
If AI creates another structural source of natural gas demand, the next question is how the upstream industry responds.
Completion activity has always been the bridge between commodity demand and production growth. Commodity prices influence capital allocation, but production cannot increase until wells are completed and brought online. Understanding where the market sits within that cycle requires looking beyond drilling activity and focusing on the operational indicators that precede production.
Those operational indices paint a picture that can be hard to see in production data, which takes long enough to collect that it often captures where the industry has been rather than where it’s headed. Production data is still valuable, but relying on it alone can sometimes cause observers to miss shifts or underestimate ongoing trends.
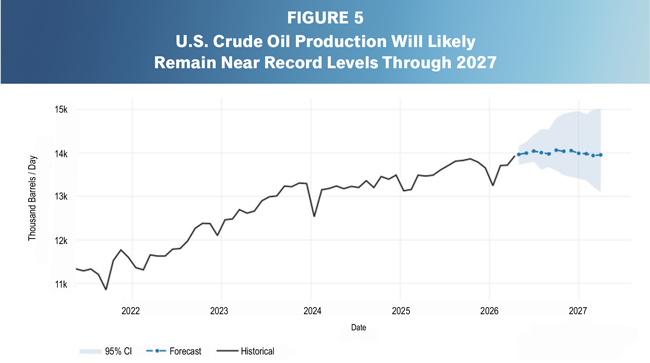
For example, the U.S. Energy Information Administration reported that U.S. crude oil production reached 13.934 million barrels per day in April 2026, which has led many industry observers to discuss when that production will surpass 14 million bbl/d.
We believe the more important question is whether the industry has entered a sustained cycle capable of producing successive production records. Our production outlook through January suggests that it has (Figure 5). In fact, the United States could set as many as four new production records over the next six months.
This forecast is based largely on detailed data about where completions are taking place and how much the resulting wells will contribute to production. Remarkably, the United States should set new production records and then quickly break them with modest changes in the Frac Spread Count™, a metric showing the number of hydraulic fracturing spreads working across the country each week.
Primary Vision expects the Frac Spread Count to remain near 200 active spreads through at least November. Activity should follow its typical seasonal pattern, with weather-related softness during August giving way to a fall rebound before easing as operators approach year-end budget exhaustion. Under current market conditions, approximately 225 active spreads appears to represent the practical upper limit of U.S. completion capacity before meaningful investment in additional equipment and labor becomes necessary.
At first glance, maintaining relatively stable completion capacity while forecasting continued production growth may appear contradictory. The explanation lies in completion efficiency.
Primary Vision compares weekly frac jobs against active frac spreads through the Frac Efficiency Index (FEI), a proprietary measure of work completed per active spread. Over the past year, FEI has improved by approximately 10%, demonstrating that operators continue completing more frac jobs with essentially the same level of completion capacity. The trend reflects longer laterals, higher pumping intensity, automation, improved completion designs, advances in frac chemistry, and continuous operational optimization, with artificial intelligence, machine learning, and advanced analytics increasingly serving as the engine that accelerates many of these gains.
These efficiency gains represent one of the most important structural changes occurring within the U.S. completion market. Completion capacity has remained relatively disciplined while operational output continues to improve. As a result, U.S. production can continue establishing new records without requiring a proportional increase in active frac spreads.
Infrastructure developments support this outlook. A new wave of Permian takeaway projects, including WhiteWater Midstream’s Blackcomb Pipeline and Energy Transfer’s Hugh Brinson Pipeline, should gradually relieve associated gas constraints over the coming months. Additional pipeline projects and system expansions planned over the next several years provide further confidence that infrastructure will continue supporting production growth.
AI data centers should not be viewed as the sole driver behind this outlook. Instead, they represent another structural source of natural gas demand alongside LNG exports, industrial consumption, power generation, pipeline exports, and a resilient domestic economy. Collectively, these demand drivers strengthen the long-term outlook for U.S. natural gas production while reinforcing the need for sustained completion activity.
Ultimately, every discussion about AI becomes a discussion about electricity. Every discussion about electricity becomes a discussion about natural gas. Every discussion about natural gas becomes a discussion about drilling and completions.
If AI adds several Bcf/d of natural gas demand over the coming decade, as our analysis suggests, U.S. producers will need to continue improving completion efficiency and operational productivity to supply that growth. Judging by the ongoing advances we’re seeing in individual plays and at the national level, that is exactly what they’re doing.
MATT JOHNSON is president and CEO of Primary Vision, a U.S.-based oil and gas analytics firm specializing in hydraulic fracturing activity, production forecasting, and operational intelligence. He leads the firm’s Frac Spread Count™ and EFRACS platforms, which provide real-time insights into completions, production, and field operations across U.S. shale plays.
A diverse background allows Johnson to view issues from a variety of perspectives to find solutions to domestic and international engineering, exploration, research and development, management, sales, and operations challenges. Before joining Primary Vision as national account manager in 2012, Johnson was vice president of business development at BAR Co. Inc. He holds a bachelor’s from Johnson & Wales University.
AVIK BHANJA CHOWDHURY is a senior research analyst at Primary Vision. He builds and analyzes proprietary datasets covering U.S. oil field services and conducts research on emerging themes such as AI-related power opportunities for the oil field services sector, communicating key insights through research articles and data visualizations.
Chowdhury has two decades of experience as an equity analyst, with most of that time spent concentrating on the oil field services sector. Before joining Primary Vision, he served as a research analyst for Market Realist from 2014 to 2018 and as a senior research analyst at eMatrix Knowledge Solutions from 2007 to 2013. He has also contributed freelance articles to Seeking Alpha since 2017. Chowdhury holds an M.B.A. from the Institute of Management Technology in Ghaziabad and a B.S. in economics from Ramkrishna Mission Narendrapur.
For other great articles about exploration, drilling, completions and production, subscribe to The American Oil & Gas Reporter and bookmark www.aogr.com.