


Power Generation Sector Outpaces Booming LNG Exports To Lead U.S. Gas Demand Growth
By Sheetal Nasta
HOUSTON–Long before Russia launched an invasion of Ukraine, international natural gas benchmark prices were very clearly and very loudly signaling a sea change in supply and demand fundamentals. Driven by supply-side tightness and dwindling inventories, European and Asian spot prices gathered major momentum in late-winter and spring of 2021, pushing regional benchmark prices to all-time highs.
Yet, throughout the first six months of 2021, prices in the well-supplied U.S. gas market remained largely disconnected from the growing upside price volatility at international pricing hubs. That began to change late last summer, when Henry Hub prices jumped from an average of $2.71 an MMBtu in January to average $5.51/MMBtu in October. Even before the start of last winter, pricing had climbed to a new level.
With the European Union imposing sanctions on Russian supplies, a western European market that had become dependent on the flow of imports from the east now is in a mad scramble to offset the huge lost supply volumes. The world is looking principally to U.S. liquefied natural gas exports to help fill the growing supply-demand gap, tightening the linkage between prices in supply-short global markets and prices in the domestic gas market.
There is no doubt that much of the run-up in natural gas futures prices is tied to the strained global LNG market and strong demand for U.S. LNG exports. Consequently, even with stable U.S. production (although it has not returned to the pre-pandemic high of 96.2 billion cubic feet a day in November 2019) and a heating season that was a virtual no-show through much of the winter, domestic storge inventories fell to their lowest levels in three years by the end of the heating season. By the third week of May–a time of year when prices are typically in a seasonal lull–all of these factors resulted in natural gas for July and August delivery trading above $9.00/MMBtu on the New York Mercantile Exchange for the first time in more than a decade.
Certainly, robust LNG exports contributed to tighter U.S. supply-demand balances during the November-March withdrawal season and have continued to spur bullish price action this spring. LNG export terminals ran full tilt this winter and feed gas deliveries posted unprecedented highs, as new liquefaction capacity was commissioned and the Ukraine war threatened energy security in Europe and heated up global competition for U.S. cargoes. Going forward, LNG exports are projected to maintain their historic clip near 12 Bcf/d.
Top Demand Driver
However, a look at winter-on-winter changes in the Lower-48 supply and demand balance reveals that the biggest demand growth driver has been domestic consumption in the primary sectors: industrial, residential/commercial heating, and most of all, power generation. The power sector accounted for 44% of the 5.4 Bcf/d year-on-year increase in total Lower-48 demand, including LNG feed gas/exports, which came in second at 32%.
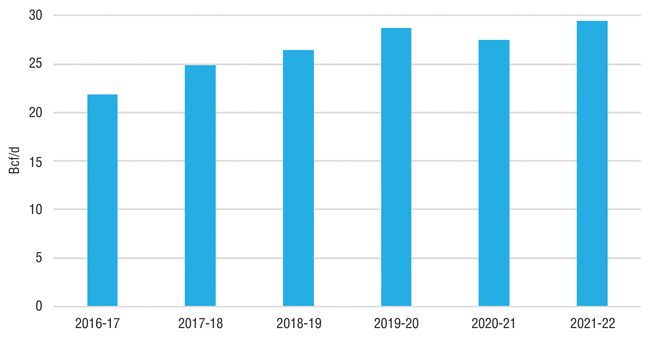
So, despite the highest natural gas futures prices in more than a decade, gas consumption for U.S. power generation is setting records. RBN Energy’s NATGAS Billboard models estimate that power burn averaged a record 29.2 Bcf/d last winter (Figure 1), with November at the highest level for that month and January eclipsing any winter month at 31.6 Bcf/d. Through April, power burn continued to set a record pace and had accounted for more than 50% of the total demand growth from the same period last year.
FIGURE 1
Lower-48 Power Burn
This is, in part, by design: Economics and environmental regulation broadly favor gas-fired plants and have pushed into retirement hundreds of coal-fired plants during the past decade, reducing price-driven fuel-switching capabilities between the two fuels. However, there is more to it than that: A tight coal market, marked by low stockpiles, high export demand and record high prices, limits gas-to-coal switching even further, making gas burn for power much more inelastic to price.
The bottom line is that power burn has played a significant role in drawing the storage inventory to a three-year low last winter and has the potential to affect storage refill this injection season. Most remarkably, power plants’ gas demand achieved these new heights during first the winter and now the shoulder seasons–generally the low-demand periods for power generation–even as gas prices trended 50%-90% higher year-on-year and hit multiyear highs this winter, and by April, soared to their highest levels in more than 13 years (up nearly 150% from last year).
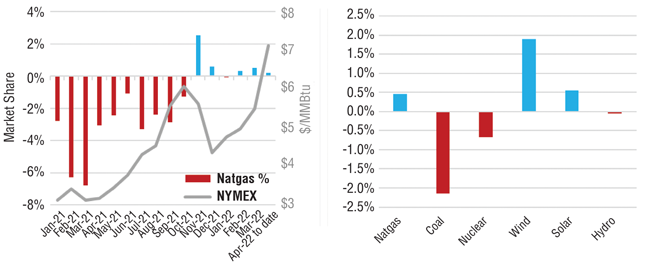
As the left graph in Figure 2 shows, natural gas power generation’s market share has increased year-on-year since November 2021 (blue bars, left axis) despite prices climbing from the $3.00-$4.00/MMBtu range earlier in 2021 to $4.00-$7.00/MMBtu later in the year and even higher in 2022 (gray line). Moreover, as the graph to the right in Figure 2 indicates, gas market share climbed even with increases in wind and solar generation. Rather, coal gave up its piece of the power-generation pie, along with nuclear to a smaller extent. In other words, even at much higher prices, gas gained market share relative to coal.
FIGURE 2
Year-on-Year Changes in Fuel Market Share of Power Generation
Reduced Switching Capacity
This is not entirely surprising, considering how economics and structural changes have forced hundreds of coal-fired generation plants into retirement in recent years, which in turn, has reduced operational capacity for coal-to-gas switching. An average of 11 gigawatts a year of coal capacity was retired during 2015-20, according to a January research note from the U.S. Energy Information Administration, based on October 2021 data. Retirements slowed to 4.6 GW in 2021, but EIA predicts 12.6 GW of coal capacity (equivalent to 6% of the operating coal capacity at year-end 2021) will retire in 2022. And as coal-fired generation capacity declines, the associated supply chains have rationalized accordingly.
Beyond the structural limitations on switching, coal-market dynamics have further constrained gas-to-coal switching. For one, coal production has lagged relative to demand and exports in the past couple of years, tightening the balance (Figure 3). Total U.S. coal production in 2015 and 2016 saw its biggest year-on-year declines to that point, leaving output at 728 million short tons (MMST) in 2016-the lowest since 1978, EIA indicates.
FIGURE 3
Coal Production versus Demand/Exports
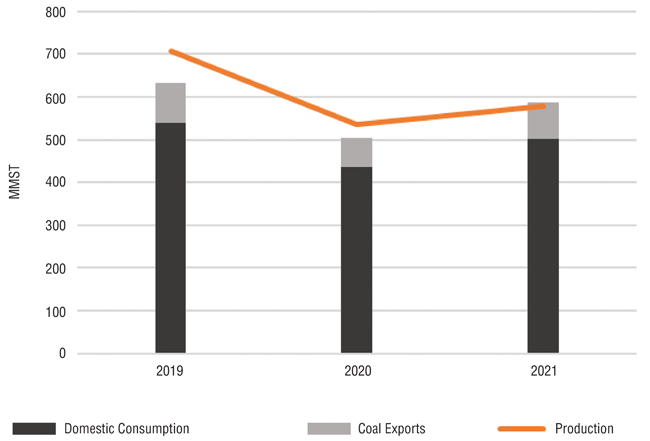
Source: EIA
After an uptick in 2017, coal production fell for three straight years. By 2020, with the pandemic raging, production slid to only 535 MMST (orange line in Figure 3), the lowest in more than five decades. Volumes recovered somewhat in 2021 to about 575 MMST, but remained well below pre-pandemic levels. Through the first 16 weeks of 2022, production totaled 181 MMST, about 5% more than year-ago levels but still 19% lower than the same period in 2019.
At the same time, outright volumes of domestic coal consumption (dark gray bar segments in Figure 3) and coal exports (light gray segments) rose a combined 81.7 MMST (16%) year-on-year in 2021. Coal’s share of total power sector fuel demand was also higher year-on-year for most months in 2021, until November, when it began losing ground to other fuels, including natural gas.
Notably, exports of steam coal or thermal coal (the kind burned by power plants to produce steam for electricity generation) climbed 47% year-on-year in 2021 and were nearly back to 2019 levels. Moreover, quarterly EIA data shows that steam coal exports in the fourth quarter of 2021 totaled 9.7 MMST, not only about 25% more than the same period in 2020, but also up 13% from the same quarter in 2019.
The lag in production relative to domestic demand and exports in 2021 left U.S. coal stockpiles at their lowest levels in decades and coal prices at historical highs (Figure 4), particularly in the U.S. Northeast, which accounts for about 60% of the country’s coal exports. Coal stocks for the U.S. electric power sector in the second half of 2021 fell to the lowest on record, according to EIA data going back to 1973, and were sitting below 100 MMST in December for the first time since 1974.
Relative Cost Comparison
As a result, Appalachian and Midwest coal prices have surged to their highest levels in more than a decade. As the light brown line in the right graph in Figure 4 shows, Central Appalachia (CAPP) coal prices averaged more than $90 a short ton (ST) in December, the highest in more than a decade, EIA indicates, and prices have continued to rise. CAPP prices for the week ending April 15 averaged $117.05/ST, nearly double the $59.70/ST in the comparable week last year. For the same week, Illinois Basin coal prices averaged $117.85/ST, more than triple the price of $34.50/ST at the same time in 2021 and also the highest level in EIA data dating to January 2011.
FIGURE 4
Electric Power Sector Coal Stocks
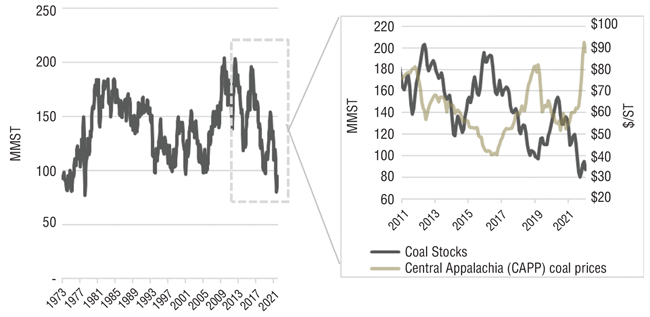
Source: EIA
A look at coal pricing on a gas-equivalency basis in Appalachia specifically shows the cost of burning coal has been higher and less economical than gas in most recent months, despite soaring gas prices. Figure 5 shows Big Sandy barge prices from Bloomberg (brown line) versus gas priced at Texas Eastern Transmission M-3 hub (blue line), courtesy of Natural Gas Intelligence.
FIGURE 5
Appalachian Coal versus TETCO M3 Gas Prices in $/MMBtu
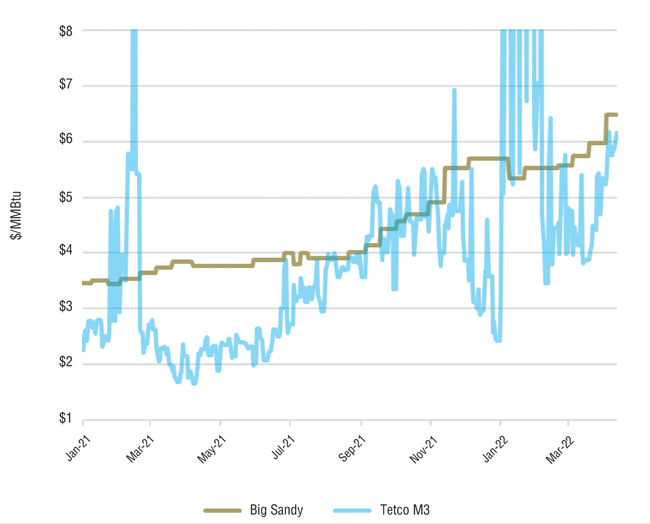
Source: RBN Energy, Bloomberg, NGI
Big Sandy coal prices are representative of the CAPP delivery zone and reported in dollars per short ton ($/ST). To convert them into gas terms of dollars per MMBtu, RBN Energy has added the transportation cost of $5 to the coal price, then converted tons to MMBtu by dividing the coal price by 25. And finally, to make the comparison apples-to-apples, the difference in coal versus gas plant efficiency rates (i.e., heat rates) is accounted for by multiplying the price by the heat rate ratio of a typical coal plant (10.5) versus a typical gas plant (7.2 in our model).
So as tight as the gas market has been lately, the coal market has been even tighter, raising the price at which switching to coal makes economic sense. Despite natural gas price premiums and supply concerns (in the absence of a stronger production response so far), the economic incentive and flexibility to switch to coal has been limited by a supply-constrained market, especially as the Ukraine war drags on and maintains pressure on European consumers to replace Russian coal.
What does this mean for the Lower-48 gas injection season? Well, fuel switching potential is typically greater during lower-demand periods for power generation (winter and shoulder months) when outright demand is lower, than during higher-demand periods (the hottest summer months) when plant utilizations tend to rise across the board. However, assuming that coal market conditions are unlikely to ease in the immediate future, the lack of that switching mechanism suggests gas burn for power is likely to remain elevated at higher gas prices even during the shoulder months. That, in turn, raises the stakes for ongoing volatility and price spikes throughout the injection season.
Editor’s Note: For updated analysis on the U.S. natural gas and crude oil markets, see RBN Energy’s daily blogs and reports at rbnenergy.com.

SHEETAL NASTA is managing editor and writer at RBN Energy LLC, with more than a decade of experience analyzing natural gas markets. She is a regular contributor to RBN’s “Daily Energy Post” articles and publishes the daily RBN NATGAS Billboard supply-demand outlook and RBN NATGAS Appalachia weekly update. Nasta previously served as manager of energy analysis for the North American natural gas market at Bentek Energy, and as a senior editor on the natural gas desk at Platts. She holds a bachelor’s from Southwestern University and a master’s from Northwestern University.
For other great articles about exploration, drilling, completions and production, subscribe to The American Oil & Gas Reporter and bookmark www.aogr.com.