


Study Highlights Upside Of Refracturing Older Wells In Organic Shale Plays
By Bob Barba
HOUSTON–While only a very small percentage of the total number of horizontal wells completed in shale plays have been refractured, the concept of restimulating mature producing wells is not new. In fact, the first horizontal shale well refracturing projects were implemented 20 years ago in open-hole Bakken Shale wells, years before the Eagle Ford, Wolfcamp, Marcellus or Haynesville plays were even discovered.
Obviously, the industry has acquired a vast amount of knowledge about fracture geometries, lateral placement, stimulation designs, reservoir characteristics, interwell communication, production behaviors, etc., as operators have progressively honed the techniques and technologies to optimize unconventional resource play development. The primary frac treatments being pumped today scarcely resemble the designs used in shale plays 20 years ago in terms of stage counts, cluster spacings, fluid and proppant volumes, pump rates, diagnostics, and numerous other variables.
The same is true of secondary frac designs—the engineering has advanced similarly to the evolution of primary frac treatments—yet refracturing remains in its infancy. An inquiry was made recently from this publication about the potential impact that refracturing shale wells could have on total U.S. production if operators more widely embraced the concept. The short answer is that the impact would be significant. Considering only five organic shale plays—the Eagle Ford, Haynesville, Permian, Marcellus and Woodford—refracs could boost existing daily domestic oil and gas output on the order of 10% while providing better economic returns to the operator than drilling and completing new wells.
With that kind of upside from assets that oil and gas companies already operate and already have capitalized, why has refracturing not become standard practice in organic shale plays? At least part of the reason is the complex interplay between primary and infill wells within a given development area. Operators realized from the start of infill development in these plays that completion activities on one well can dramatically influence the production behavior of offset wells. Understanding the relationships and the potential pressure/fluid connectivity issues between partially depleted parent wells and newly completed child wells continues to be a major technical focal point for operators.
Two Components
In terms of a refrac, there are two components to consider: the actual uplift on the refractured well’s production (the reward), and the opportunity loss of production from a suboptimal asymmetric frac forming on adjacent offset wells as a result of preferential frac growth into the pressure-depleted area surrounding a primary well (the risk). The good news is that research results indicate substantial production uplift with compelling economics when targeting older candidate wells with wider primary frac cluster spacing. As long as refrac designs protect offset wells from negative effects of asymmetric frac growth, the reward far outweighs the risk.
The workflow for this study evaluated new well performance (P50 EURs) in the Eagle Ford, Haynesville, Permian, Marcellus and Woodford to estimate the uplift from proper infill well protection when primary wells are refractured in the pad zipper pattern to avoid opportunity production loss related to asymmetric fractures.
The study indicates that the potential uplift from refracturing one in 10 of the 36,302 available wide-cluster spacing candidates in organic U.S. shale plays is more than 1.28 million barrels of oil and 10.8 billion cubic feet of gas a day. This represents an equivalent production response to a meaningful increase in new well drilling activity without having to add a single rig or make the massive capital investment a huge uptick in new well drilling will require.
Looking by basin, the actual P50 post-refrac uplift is well documented for both the Eagle Ford and Haynesville, with 191 total single-well lease refracs completed to date between the two plays. These results are conservative relative to expected future refrac performance, since a large number of these 191 refracs did not utilize what are now considered routine best practices, such as extreme limited-entry perforating (XLE).
Forecasts for the Permian were made from a comparison of wide-cluster spacing legacy well completion recovery factors, with more recent close-cluster spacing fracs showing the uplift in total recovery factor with improved completions. Refracs with properly designed XLE treatments have been shown to have similar total recovery factors to new wells, i.e. ±14% total recovery in oil plays (total recovery is defined as the refrac EUR plus the cumulative production prior to refracturing).
In the Marcellus and Woodford, expected refrac performance is based on the results of the actual refracs in the Eagle Ford and Haynesville compared with new well EURs, since the latter can be estimated in all areas.
To reinforce the point, the workflow evaluated the production uplift from using zipper refracs of parent wells to eliminate a significant opportunity production loss in offset infill wells when a parent well refrac creates asymmetric fractures (the proximal tip of the infill well contacts the depleted region adjacent to the primary well). Once a path of least resistance is encountered, frac growth on the distal side of the infill well ceases before the slurry stages. In the Eagle Ford, these depleted regions can extend 600 feet or longer and offset new well fracs have been observed 1,000 feet from the infill well. Well spacings in many areas of the Eagle Ford are less than 450 feet.
Once the frac from a new well contacts the depleted region around the primary well, the frac becomes asymmetric toward the pressure sink and up to 40% of the EUR for the infill well can be lost. If a primary well is not refractured at the same time as the infill wells in the zipper or simulfrac pad completion, the combination of lost production from the potential refrac itself and losses in the infill well can be significant. These phenomena are not restricted to the Eagle Ford and are not formation-specific; they are the result of reduced closure stress at lower reservoir pressures, and occur 100% of the time in all basins.
Candidate Selection
To estimate the expected production uplift, the total number of refrac candidates first needs to be established. With cluster spacing widely recognized as the most important variable in recovery factors, the workflow begins by reviewing historical cluster spacing versus time.
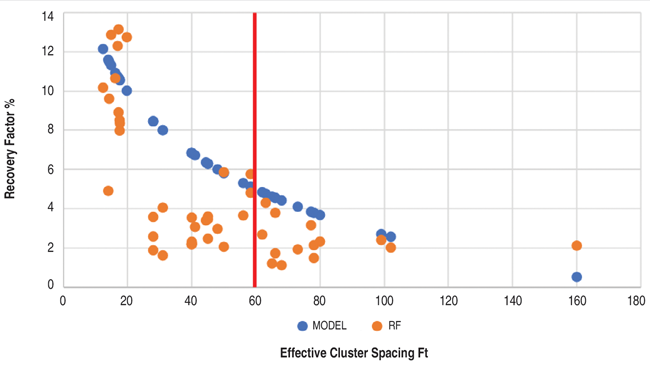
Figure 1 shows a comparison of recovery factor versus cluster spacing from comparisons between EUR and oil in place (OIP) using a model developed by researchers at the University of Texas at Austin’s University Lands (UL) group (see SPE 199721 “Effective Cluster Spacing Plays the Vital Role in Unconventional Reservoir Development: Permian Basin Case Studies,” by Hongjie Xiong, presented at the 2020 Hydraulic Fracturing Technology Conference & Exhibition). The blue dots are the results of UL’s simulation model and the orange dots are estimated from a comparison of OIP with EURs.
FIGURE 1
Recovery Factor versus Cluster Spacing Calibration
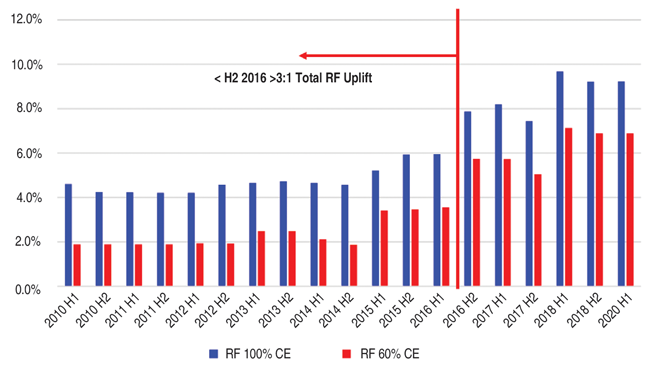
The UL model assumed 100% cluster efficiency. However, prior to the advent of XLE in 2018, very few wells had high cluster efficiencies. Several studies have suggested that poorly diverted completions have ±60% cluster efficiencies. Figure 2 shows the results when the 100% cluster efficiency model and the 60% cluster efficiency model are applied to the historical cluster spacings for 802 Eagle Ford wells with cluster spacing data. The expected total recovery factor is in the 4% range until after the second half of 2016. With a ±14% expected total recovery factor, this suggests that the total recovery factor can be increased with refracs by at least a factor of three for wells completed prior to the second half of 2016.
FIGURE 2
Eagle Ford Recovery Factor History
A review of historical cluster spacings in the other areas reveals a similar trend. In the Permian Basin, a major operator did not drop below 60-foot cluster spacing until July 2016, translating to a range of expected recovery factors from 2.7% with 60% cluster efficiency to 5% for 100% cluster efficiency. The operator completed its wells during that period with 40, 0.42-inch perforations per stage, equating to a range of pre-erosion perforation pressure drops from 423 psi for 100% efficiency to 1,123 psi for 60% efficiency. Both are well below the 2,500-3,000 psi needed to obtain 100% efficiency.
Top Refrac Priority
Using the second half of 2016 as a cutoff for a greater than three-to-one uplift in total recovery from refracs, there are 36,302 wells in the five major organic shale plays based on wide cluster spacings. While not all of these candidates will have sufficient oil and gas in place for economic refracs, that uncertainty can be derisked with petrophysics prior to proposing a refrac. Preliminary screening of a large number of Eagle Ford and Haynesville wells indicates that at least 70% of the refrac candidates based on wide cluster spacing should be economic (defined by a 20% or higher internal rate of return).
The top priority for refracs should be primary wells with offset infill wells waiting on completion. Refracs compete with new wells for capital, and if operators are not willing to part with 40% of a new infill well’s EUR, a refrac is mandatory. This should guarantee that a frac crew will be available for the refrac since the infill wells on the same pad most likely will be fractured. This is not the case for opportunity refracs with no primary-infill issues where a limited number of spot crews are available. This can delay the execution of the standalone refracs, but also accelerate the execution of the primary wells on pads awaiting development.
The total number of upcoming infill wells is known from the inventory of drilled but uncompleted wells, wells being drilled and permits. As of early December, there were 7,585 total DUCs, new drills and permits for the Eagle Ford, Haynesville, Permian, Marcellus and Woodford. Of these, 25% (1,896 wells) were assumed to have primary-infill asymmetry issues with potential 40% losses in EURs and IPs per infill without primary well refracs. Two major organic shale operators indicate that 50%-80% of their infill wells have these issues, meaning the 25% estimate should be conservative.
Production Forecast
To forecast production from refracs, it is assumed that 10% of the total pool of 36,302 wide-cluster spacing wells in the five plays would be refractured. This would involve 3,630 total refracs with 1,896 infill protection refracs and 1,734 standalone refracs with no infill protection uplift. A total of 34 Eagle Ford and 45 Haynesville mechanical isolation refracs were evaluated from single-well lease production out of 197 known refracs to date in the Eagle Ford and 170 in the Haynesville.
The post-refrac EURs from refracturing were allocated on a monthly basis over 30 years using type curves for the various areas. For the daily rate forecast, the first month’s production required to generate the EUR with the type decline was used rather than the actual first month’s production, since operators often utilize choke management to manage drawdowns because of the high percentage of unpropped area in the stimulated reservoir volume.
A comparison was made between the last full month’s production prior to refrac and the normalized first month’s post-refrac production. The average reduction of the post-refrac first month’s production was 6% to subtract the last month’s production prior to the refrac since that production will be taken off line once a refrac is completed. This multiplier then can be used for the Permian, Marcellus and Woodford, which do not yet have significant refrac activity.
The P50 EUR for the Eagle Ford is 331,199 barrels of oil and 454 million cubic feet of gas, which represents an initial production uplift of 308 bbl/d of oil and 423 Mcf/d of gas. The Eagle Ford gas window has a P50 EUR of 1.974 Bcf and 198,981 barrels of condensate. This translates into an uplift of 2.58 MMcf/d and 256 bbl/d of oil. The P50 EUR for the Haynesville is 4.757 Bcf, or an uplift of 4,809 MMcf/d (94% of the 5,100 MMcf/d allocated initial month’s rate).
The Permian organic shale uplift used a cluster spacing versus recovery factor model that was supported with measured recovery factors for both legacy and new wells. The P50 EUR for the Permian is 473,501 barrels of oil and 1,327 MMcf of gas, translating into to an initial production uplift of 609 bbl/d of oil and 1,706 Mcf/d of gas. Actual recovery factors were estimated in the southern Midland Basin from wells with mapped OIP and EUR data by comparing OIP/acre to EUR/acre. The drainage radius in acres was assumed to be 330 feet based on rate transient analysis work that was part of UL’s 2020 HFTCE paper.
The study had 10 wells with average cluster spacing of 56 feet. This should be a good proxy for the basin as a whole prior to the second half of 2016, since a major operator (whose practices were emulated by many other operators) was using cluster spacing of 60 feet or more. The P50 recovery factor for these 10 wells was 4.6% (versus 5.3% from the UL model with 100% cluster efficiency). The well dataset that was used averaged 1,200 psi perforation friction, so it is unlikely that the completions had 100% cluster efficiency. A second finding was the P50 recovery factor for new close-cluster spacing completions was 13.7% for a 9.1% expected recovery factor uplift with a best practices XLE completion.
Applicable To All Areas
Subsequent work in the Eagle Ford oil window supported the applicability of both the cluster spacing versus recovery factor model and the 330-foot drainage radius. Gas reservoirs in the Eagle Ford and other areas have wider drainage areas because of the increased mobility of gas versus oil in low-conductivity fractures at the distal extent of the fractures. Radii of 440-660 feet have been assumed with reasonable results in several studies in gas-prone areas. A second difference between oil and gas reservoirs is the role of sorbed gas in the gas reservoirs, which can increase the gas in place by 20%-30%. It can be estimated from total organic carbon and laboratory data.
For plays without significant activity or similar recovery factor studies, it was assumed that the ratio between refrac EURs and total EURs for the areas with both would remain relatively constant. There is an error bar from possible differences in cluster spacing, but the majority of the pre-2016 completions had cluster spacings in the 50-60 foot range and the expected uplift in recovery factor should be in the same range. The total EUR from completions with close cluster spacing and high loading serves two purposes: using the above correlation for the areas without significant activity, and estimating the potential damage from poor infill well protection.
TABLE 1
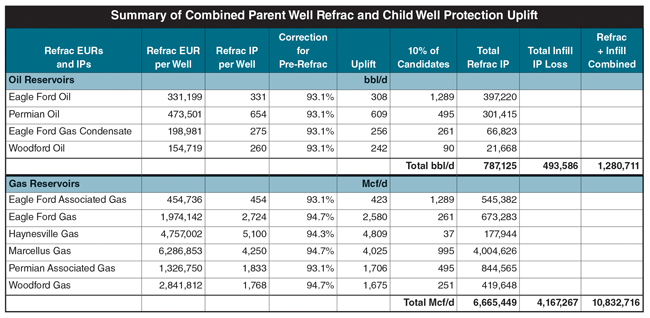
The lost production savings value from a primary well refrac was assumed to be 40% of the P50 new-well EURs for all areas. This metric involved the use of a P50 EUR new-well EUR to assess the lost bbl/d of oil and Mcf/d of gas from an asymmetric fracture. To accomplish this, it was necessary to have wells with close cluster spacing and high proppant and fluid volumes and adequate producing time to get a reliable EUR. The period chosen for this was 2019 since cluster spacing had converged on 20 feet and below by then, proppant and fluid volumes were in the range used today, and XLE was becoming more widely implemented. All of the 2019 completions were reviewed and the first 12 months’ production was used to identify the P50 cumulative production range. It was assumed that this would be a proxy for EURs since calculating EURs on all 2019 completions would not be realistic. All of the production numbers (cumulative and EUR) were summarized on a per foot basis to normalize for lateral length. Table 1 presents a summary of the expected uplifts.
Economic Comparison
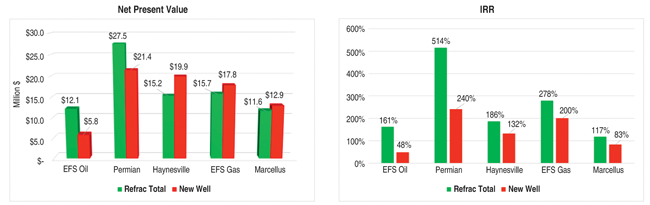
With the ongoing competition for completion dollars between existing well refracs and new-well completions, an economic comparison is in order. As shown in Figure 3, the rates of return are superior for refracs in the Permian, Marcellus, Haynesville and both the Eagle Ford oil and gas windows (the Woodford was not included in this part of the analysis). On a net present value basis, Eagle Ford and Permian refracs of wells with primary-infill issues have higher NPV10s than new wells. In the other areas with refrac NPVs less than new wells, the best practices bar was not raised very high with the actual refracs used for the economic analysis.
Specifically the Haynesville lags in both NPV and IRR primarily because of the high treating pressures and widespread use of 3.5-inch cemented refrac liners inside the 5.0-inch casing in the majority of the wells. With current refrac practices, there is limited room between the surface treating pressures and maximum wellhead pressures to incorporate a 2,500-3,000 psi pressure drop across the perforations to achieve 100% cluster efficiency.
FIGURE 3
Per Well P50 Refrac versus New Well Economics
The use of expandable liners, zero-degree phased perforations, microproppant and fewer larger-diameter holes should lower the treating pressures enough to make room for a 2,748 psi differential pressure at the 60 bbl/minute pump rate expected with an expandable liner (versus 45 bbl/minute for 3.5-inch cemented). If these techniques can raise the expected recovery factors from the 60% range with low XLE differential pressures to 100% the NPV for a P50 Haynesville primary well, refrac values should exceed the new-well values exactly as they do in the Eagle Ford and Permian.
Refracs long have been the “red-headed stepchildren” in the industry, with many operators lacking a comfort factor with restimulating producing wells. This study should increase that comfort factor significantly. Refracs are now clearly a viable option to grow production with economic returns superior to new wells in cases where primary-infill issues are present. Refracturing only 10% of the wide-cluster spacing candidates should grow U.S. oil and gas production by 10%.
This is in addition to the benefits that refracs offer in terms of lower capital requirements, much fewer supply chain issues, and a lower carbon footprint. In many cases, capital allocated to refracs will have a higher NPV and rate of return than capital allocated to new wells while still reaping all of the benefits. This makes a case for operators to invest more of their capital in refracs if they want to maximize the present value of their organic shale assets. r
Editor’s Note: For additional analysis of the economic rationale for refracturing, see “Economics, business trends put refracs in favorable light in oil and gas resource plays,” by Mark Rossano and Bob Barba in AOGR’s August 2022 issue.

BOB BARBA is owner and chief executive officer of Integrated Energy Services, which specializes in developing integrated petrophysical models to predict well performance from well and completion data, and SkyCNG, which helps customers convert all types of engines to natural gas at a significantly lower cost than electric vehicles. A past Society of Petroleum Engineers distinguished lecturer on completion design optimization using petrophysics and reservoir engineering, Barba is a recognized expert on refracturing mechanics and practices. He has pioneered techniques to evaluate well performance in organic shales using production and well log data. Barba holds a B.S. in biochemistry from the U.S. Naval Academy and an MBA from the University of Florida.
For other great articles about exploration, drilling, completions and production, subscribe to The American Oil & Gas Reporter and bookmark www.aogr.com.