


Midstream Projections
Capital Investments In Infrastructure Projects Expected To Remain Strong
By Kevin Petak, Ananth Chikkatur and Julio Manik
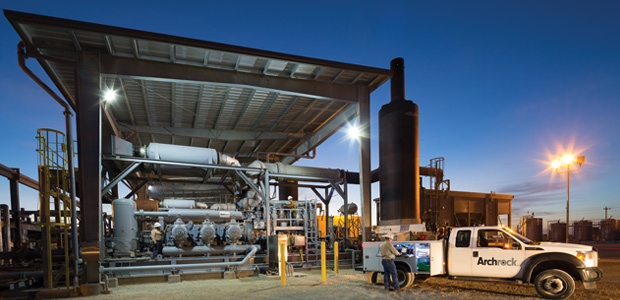
FAIRFAX, VA.–The down cycle that began in late 2014 has hit all aspects of the North American industry hard, including midstream and transportation infrastructure development. While longer-range infrastructure planning clearly was impacted, the good news is that the industry will continue devoting a high level of capital expenditures to building new midstream and transportation facilities in 2017 and well into the foreseeable future.
To assess future infrastructure needs, the Interstate Natural Gas Association of America’s INGAA Foundation sponsored a study to help answer questions about how the two-year downturn’s low commodity prices could influence infrastructure build-out activity in the future.
Given prevailing market uncertainties and commodity prices’ critical role in projecting infrastructure needs 10-20 years into the future, the analysis considers two distinct recovery scenarios: a “high case” that assumes a relatively short U-shaped recovery to $75 a barrel oil and $4.00 an MMBtu gas, and a “low case” that reflects a V-shaped recovery with a considerably slower oil price rebound and 15 percent lower long-term gas prices.
In both scenarios, 70 percent of new wells are expected to be oil and 30 percent gas, but more than 820,000 new wells would be completed by 2035 in the high case compared with 682,000 in the low case. The high case projects natural gas production increasing 1.8 percent annually (topping 130 billion cubic feet a day by 2035), with natural gas liquids production tracking gas output to grow from 4.2 million to 6.5 million barrels a day during the 20-year period. This compares with 110 Bcf/d and 5.7 million bbl/d, respectively, for the low case.
Although the study analyzed natural gas, NGL and crude oil infrastructure, this article focuses on the findings related to natural gas and NGLs. This includes gas gathering and lease equipment, processing, pipeline transportation, storage and liquefied natural gas export facilities, as well as NGL pipeline transportation, fractionation and export facilities.
Driven By Shale Plays
Shale gas production growth is forecast to be robust, motivating the development of new natural gas infrastructure. In fact, onshore shale plays should account for two-thirds of all North American gas production by 2020, growing to nearly 75 percent by 2035. A substantial portion of that new natural gas production will continue to contain relatively high liquids contents. Associated gas production from oil wells could reach as high as 19 Bcf/d by 2035, which would represent an increase of 2.6 Bcf/d.
In total through 2035, North American natural gas transportation capacity additions are projected to range between 44 Bcf/d and 58 Bcf/d, with a midpoint value of 51 Bcf/d. For NGL infrastructure, capacity additions are projected to range between 1.1 million and 2.3 million bbl/d, with a midpoint of 1.7 million bbl/d (incidentally, the estimated midpoint value of oil pipeline capacity additions during this period is 5.7 million bbl/d).
With the aggressive development of unconventional resources, the industry invested $40 billion-$50 billion annually in infrastructure projects between 2010 and 2015. The high level of natural gas and NGL infrastructure construction continued in 2016, despite the low commodity prices. Nearly half of all new natural gas capacity additions originate in the Marcellus/Utica region. Significant new capacity also is being built in the Gulf Coast/Southwest area, associated mostly with LNG and Mexican exports.
Marcellus and Utica transport capacity is forecast to increase as much as 12 Bcf/d through 2020, partly to support natural gas exports. Between 2020 and 2035, another 15 Bcf/d of incremental capacity would be built across North America in the high-case scenario, mostly to satisfy growth in gas-fired power generation. With the low-case scenario projecting much more modest gas-fired generation growth, only about half of the post-2020 natural gas capacity would be added.
Capital Expenditures
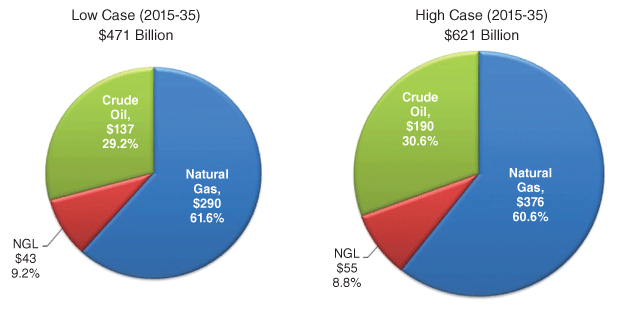
Even in the low-growth case, some $23.5 billion a year would have to be invested in infrastructure, increasing to more than $30 billion annually in the high case. The total required capital expenditure investment in infrastructure from 2015 to 2035 is estimated to range between $471 billion and $621 billion (Figure 1), with a midpoint expenditure of $546 billion ($27 billion annually).
FIGURE 1
Capital Expenditure Estimates for New Infrastructure ($/billion)
Investments in pipelines (including both transmission and gathering lines and compression and pumping) range from $183 billion to $282 billion, with a midpoint capital spend of $232 billion. Most of the pipeline activity (more than 60 percent of the total capex invested) is expected to be associated with natural gas development, with much lesser investment in assets related to NGLs (less than 10 percent) and oil (roughly 30 percent of total capex invested in pipelines).
Significant portions of the pipeline investment will be for lease facilities infrastructure (28 percent) and gathering/processing systems (21 percent). The majority of the expenses associated with gathering will be spent on processing and fractionation equipment, followed by pipe, and compressors and pumps. Transmission and storage account for another 30 and 15 percent, respectively, of the investment in pipeline development, the majority of which is devoted to natural gas.
According to the study results, the key midpoint-value metrics identified for 2015-35 include adding 296,000 miles of gathering and transport pipelines for oil, gas and NGLs. About 85 percent of that total (257,000 miles) will be new gathering lines to collect incremental production of more than 750,000 oil and gas well completions, with the remaining 15 percent (39,000 miles) new transmission pipeline. Total compression and pumping horsepower needed for all gathering and transmission lines is 15.8 million, including 8.7 million for gas gathering applications. The total capex requirement for this midpoint level of pipeline infrastructure build-out (including pumping and compression needs) is estimated at $232 billion.
Significant Impacts
The metrics clearly demonstrate the need for considerable new infrastructure, despite the market changes that have occurred during the past few years. Even in the low case, significant infrastructure development will be required to accommodate production growth and facilitate the development of LNG and Mexican exports.
In the high case, an average of 41,150 new oil and gas wells will be drilled and completed each year through 2035, adding 290 Bcf of new working gas capacity for storage and another $4.8 billion to industry capex requirements. In the low case, the industry would complete an average of 34,100 new wells annually to add 120 Bcf of new working gas capacity for storage at $2.3 billion in capex.
Importantly, the study projects significant employment impacts from new infrastructure development. In fact, every $100 million invested in new infrastructure creates an average of 70 jobs, employing as many as 425,000 people a year and creating hundreds of billions of dollars in economic value and tax revenues. While many of the economic benefits will accrue directly to companies active in midstream development, numerous industries will enjoy many indirect and induced benefits, and a substantial number of service sector jobs will be created as a result.
Consequently, all sectors and all regions of North America would benefit from infrastructure development. The top 10 states with total employment resulting from midstream investment are expected to be Texas, Pennsylvania, Louisiana, Ohio, California, New York, Oklahoma, Illinois, Kansas and West Virginia. Texas will have the most significant job creation as a result of LNG export activity and shale gas and tight oil development. Pennsylvania and Louisiana will gain similar levels of employment. Pennsylvania’s job creation is driven by Marcellus/Utica development, while Louisiana’s job creation relates to LNG export facility development.
FIGURE 2A
Natural Gas Flows in 2015 (MMcf/d)
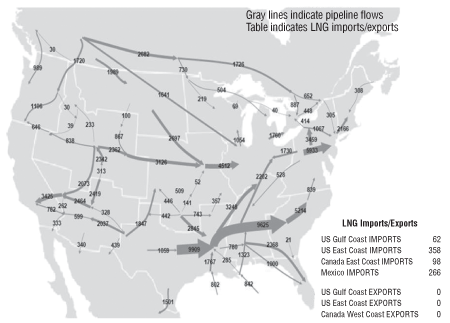
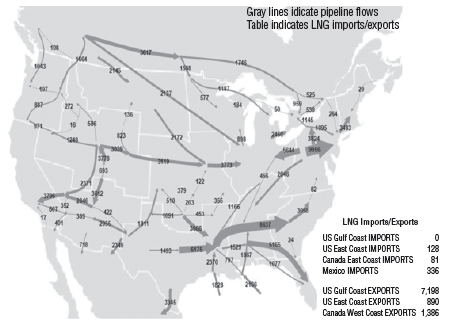
FIGURE 2B
High Case Natural Gas Flows in 2035 (MMcf/d)
Natural Gas Infrastructure
Looking specifically at natural gas infrastructure needs, the study examined future flows along various pipeline corridors based on expected capacity additions and supply/demand trends. Figure 2A shows gas flows in 2015, while Figure 2B shows 2035 projections for the high case. The differences are used to evaluate how the flow patterns are likely to change over time, with attendant implications for capacity additions. Between 2010 and 2014, 34 Bcf/d of incremental takeaway capacity was added in North America. Between 2015 and 2035, 58 Bcf/d of incremental take-away mainline capacity is projected, led by projects in the Northeast (31 percent of the annual total) and Southwest (23 percent) regions.
Figure 3 compares miles of new gas gathering (purple) and transmission (blue, red and green) pipeline added in both the high and low cases. The high case is projected to add an average of 8,500 miles of new gathering lines and 1,400 miles of new transmission lines each year through 2035, while the low case adds 7,100 miles of gathering lines and 850 miles of transmission lines each year.
FIGURE 3
Miles of New Gas Gathering and Transmission Pipeline
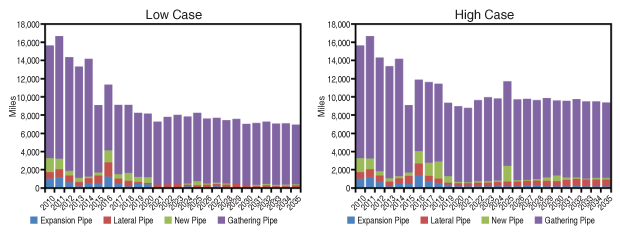
In either case, infrastructure development is expected to be more robust in the nearer term, with several projects already under construction or in an advanced planning stage, especially for transmission pipelines. Lower levels of new pipeline installations are anticipated after 2020. Still, significant investment is needed to support the robust natural gas incremental infrastructure builds. In the high case, an average investment of $17 billion a year is required through 2035, totaling $353 billion in 2015 dollars. The greatest change in the low case would be reduced expenditures for gas transport pipelines, which would drop $2.3 billion a year, lowering the average investment to about $13 billion a year.
In addition, industry investments in gas processing capacity are expected to average $1.2 billion-$1.7 billion a year, while investments in gas storage and export (both LNG and NGL) facilities are estimated at $4 billion-$4.5 billion annually.
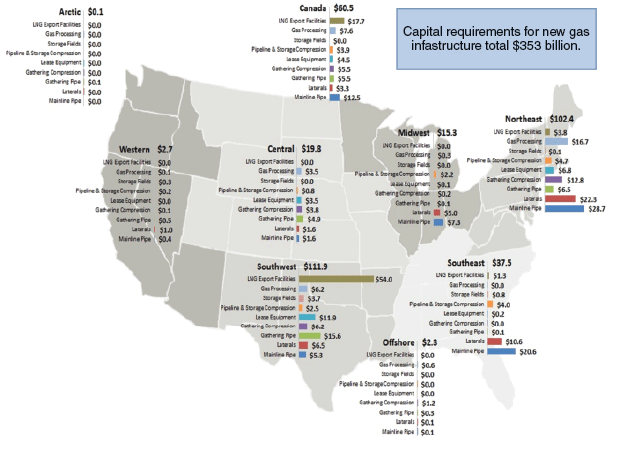
Figure 4 shows regional capital expenditures for gas infrastructure in the high case. In either case, however, the largest share of regional investment (31-34 percent) will occur in the Southwest, given significant regional shale gas development and expanding Gulf Coast LNG export infrastructure. Another 29-30 percent of the total investment will be in the Northeast region. Together, these regions are forecast to require $171.5 billion-$214.3 billion in gas infrastructure investment.
FIGURE 4
High Case Regional Natural Gas Expenditures
(2015-35, $/billion)
NGL Pipelines
In the high case, an overall 2.3 MMbbl/d of takeaway NGL pipeline capacity would be added in North America through 2035 (1.1 MMbbl/d in the low case). Most of this capacity would be added in the Midwest, Northeast and Southwest, with the bulk of it installed by 2020. That compares with 550,000 bbl/d of new capacity installed in 2015, and an average of 5.4 MMbbl/d of incremental capacity added between 2010 and 2014.
Domestic demand is not expected to absorb all NGL production growth, opening the door to more U.S. exports from the Gulf Coast, Mid-Atlantic (Marcus Hook, Pa.), and Pacific Northwest, especially with expected rises in competitive prices for domestic NGLs in the global market.
Given the Marcellus and Utica plays’ significant output, Northeast NGL production is expected to grow the most, while more limited growth is expected from the Eagle Ford in South Texas and the Montney in Western Canada. Significant infrastructure investment will be needed during the next 10 years to link these supplies with market hubs at Mont Belvieu in Texas, Conway in Kansas, Sarnia in Ontario, and Aux Sable in Illinois. These markets are attractive because of their relatively high liquidity, storage capacity and connectivity to other markets–including to export facilities, particularly from Marcus Hook, which is the closest export option for Marcellus/Utica NGL production.
In the high case, NGLs from the Northeast are projected to be transported as raw NGLs (y-grade mix) to the Gulf Coast to supply ethylene crackers and propane dehydrogenation facilities. A limited number of fractionation facilities also are projected in the Northeast. As a result, a large share of Marcellus/Utica NGLs that are not contracted for export to Marcus Hook will flow to the Gulf Coast toward Mont Belvieu, while a smaller share will flow to Sarnia, requiring 12,000 miles of new NGL transmission lines through 2035.
Enterprise Products Partners’ Appalachia-to-Texas (ATEX) Pipeline is flowing ethane and propane from the Marcellus/Utica to Mont Belvieu. Kinder Morgan’s new Utica Marcellus-to-Texas Pipeline (UMTP) to transport y-grade mix to Mont Belvieu is expected to come on line in 2018. In addition, Kinder Morgan’s proposed Utopia East project would transport as much as 75,000 bbl/d of ethane and ethane-propane mixtures from the Northeast to Ontario.
In the low case, 2,400 fewer miles of new pipeline would be installed with lower NGL production in the Northeast, favoring rail and truck transport to the Gulf Coast and other demand centers. Furthermore, with more limited pipeline capacity, more new fractionation facilities would be projected in the Northeast, closer to supply sources. In the Midwest and Central United States, modest NGL production growth would be expected to make its way to the Mid-Continent and Gulf Coast though the Overland Pass, Bakken and Mid-America pipelines.
In the high case, the new pipelines would need to be supported by 450,000 horsepower of pumping to move the liquids. The relatively high pumping need would allow for repurposing of oil pipelines with additional pumping.
Fractionation Capacity
In addition to a significant investment in new NGLs transportation, the high case projects almost 3 MMbbl/d of fractionation capacity to separate the liquids into various purity products, and 1.7 MMbbl/d of new export capacity to facilitate the movement of liquids to foreign countries. Most of the new fractionation capacity will be built in the Gulf Coast, but also in the Midwest and Northeast to support production growth from the Marcellus/Utica. In the low case, new fractionation and LNG export capacity would be reduced by 19 and 13 percent, respectively.
The total capital investment in NGL infrastructure is almost $55 billion throughout the projection period for the high case, averaging $2.7 billion a year, including $28 billion in investments for NGL fractionation and export facilities. The low case would reduce that investment by 25 percent to $43 billion, or $2.15 billion on an annualized basis.
By region, the largest NGL infrastructure investment for the high case (Figure 5) would be in the Southwest ($25.3 billion), driven by production growth from the liquids-rich Eagle Ford, Anadarko Woodford and Permian Basin plays. The region would require $6 billion for propane export facilities, $10 billion for NGLs fractionation capacity, and $9 billion for new pipelines.
FIGURE 5
High Case Regional NGL Expenditures (2015-35, $/billion)
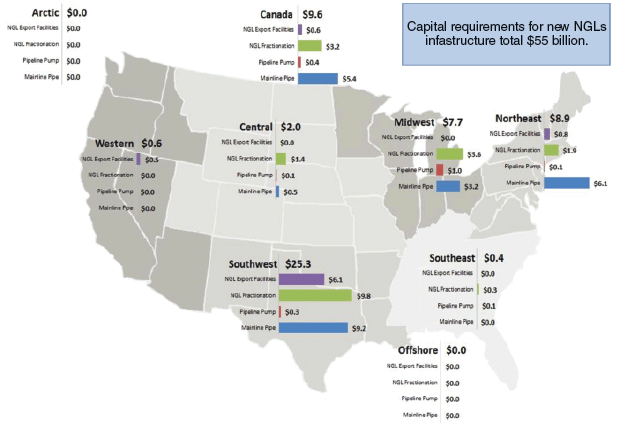
Additional large expenditures in the Northeast ($8.9 billion) and Midwest ($7.7 billion) would be derived from high NGL production growth from the Northeast, requiring substantial new pipeline and pumping capability to transport liquids produced from the Marcellus/Utica for fractionation in the Gulf Coast.
Although clearly impacted by the severity of the industrywide downturn, gas and liquids infrastructure development will continue to be robust in North America, particularly during the next four years. However, no matter which of the two analysis scenarios unfolds over the coming two decades, total infrastructure investments will be substantial–on the order of $22 billion-$30 billion each year.
Historically, the industry has proven its ability to finance and construct the projected levels of pipeline and gathering capacity build-out determined in this study. In fact, the projected future investments are consistent with the industry’s investment levels in infrastructure development in recent years.
Editor’s Note: The INGAA Foundation’s complete report on North American infrastructure development needs can be downloaded at www.ingaa.org/foundation/foundation-reports/27958.aspx. The study was conducted by ICF International on behalf of INGAA Foundation. The authors acknowledge ICF International colleagues Srirama Palagummi and Kevin Greene for their contributions to the report.
KEVIN R. PETAK is vice president of natural gas and fuels market modeling at ICF International in Fairfax, Va. He has more than 3 decades of experience in the energy industry. Petak also directs ICF’s gas market subscription services, which are the source for much of the information provided in this article. Prior to joining ICF, Petak worked for Halliburton. He holds a B.S. in petroleum and natural gas engineering from Pennsylvania State University and an M.S. in business from the University of Texas at Dallas.
ANANTH P. CHIKKATUR is a manager in the natural gas and fuels markets division at ICF International. He has more than a decade of industry experience. Chikkatur has supported developers, private equity firms, utilities, governments and international organizations, and has led projects in LNG market assessment, pipeline infrastructure, and gas supply/demand balance. Before joining ICF, he conducted research at Harvard’s Kennedy School of Government. He holds a B.S. in physics from University of Rochester and a Ph.D. in physics from the Massachusetts Institute of Technology.
JULIO MANIK is a technical specialist in the natural gas and fuels market division at ICF International. He has 20 years of experience in energy modeling, engineering economic evaluations and reservoir engineering. He is the lead analyst on hydrocarbon supply curves, oil and gas drilling and production, gas supply/demand modeling, and midstream infrastructure analysis. He holds a B.S. in gas and petrochemical engineering from the University of Indonesia at Jakarta and an M.S. and Ph.D. in petroleum and natural gas engineering from Pennsylvania State University.
For other great articles about exploration, drilling, completions and production, subscribe to The American Oil & Gas Reporter and bookmark www.aogr.com.