


Powerful New Ways To Gather Drilling Data Accelerate Industry Progress
By Colter Cookson
Drilling is one of many disciplines that exemplifies the idea that knowledge is power. The more drillers know about the downhole environment and the interactions between each component of the drill string, the easier it is for them to select the right equipment and drilling parameters to deliver high-quality wellbores quickly and consistently.
But even the most data-hungry companies can only invest so much time and money into understanding the geology and drilling dynamics of any given well. They must balance their desire to know more against the cost to acquire and act on the information.
“Operators are looking for better reservoir insights, but they’re also trying to get those insights cost effectively,” says Andres Matheson, vice president and North America region manager for Geolog International (GEOLOG). “Traditionally, a lot of information came from downhole wireline tools, logging-while-drilling tools, or core samples.”
Those technologies have proven track records, but running the necessary equipment downhole introduces costs and risks that sometimes outweigh the benefits, Matheson says. These situations are becoming more common as laterals lengthen, which increases both the time it takes to complete wireline runs and the risk of tools getting stuck.
Fortunately, the industry is learning to extract more detailed information during routine operations. As a case in point, Matheson points to drill cuttings and drilling fluids, which can be examined at the surface during drilling to assess the downhole environment. He describes cuttings as an invaluable source of quality organic and inorganic geological and geochemical data.
Meanwhile, the hydrocarbons released in the drilling fluids during drilling can be measured and quantified to characterize the reservoir’s productivity and fluid properties. Matheson says integrating the data and interpretation from analyzing cuttings and drilling fluids can provide comprehensive and valuable inputs to aid well planning, target placement and completions optimization.
“Surface logging is bringing more analytical measurements to the field that were once only available in a laboratory,” he adds. “For example, XRF and XRD analysis on drill cuttings that might have been done after a well was drilled can now be performed in near-real time during drilling. We can use that information to build better geological models and help steer the well.”
Enabling Technology
Getting detailed data from cuttings is possible partly because of digital tools and AI technology. Matheson says GEOLOG’s systems automatically and quantitatively image cuttings and analyze their brightness (a function of red-green-blue primary color that is strongly linked to facies), white light and UV light color spectrums, as well as other physical properties, such as cuttings particle shape and size. When combined with elemental and mineralogical data from XRF and XRD, these interpreted datasets help define and quantify lithofacies and detailed reservoir layers that the bit is encountering, meaningfully reducing subsurface uncertainty.
The cuttings can also help companies assess fluid composition at each point in the well. “We can thermally extract the hydrocarbons and produce detailed chromatography from C9 to approximately C40. That allows us to look at biomarkers in the mud system and characterize it as condensate, light oil, oil, heavy oil, or paraffinic oil,” Matheson explains.
Such fluid type fingerprinting can be enhanced by looking at the hydrocarbon gas in the mud, Matheson notes. He says the company is refining hydrocarbon gas collection techniques to get more useful information.
“The majority of the industry uses a regular, QGM-style gas trap to agitate the mud and extract the mud gas,” he says. “Instead, we extract the hydrocarbon gas at a constant temperature and volume. These fixed conditions let us perform quantitative analyses on the gases and compare results from one part of the well to another or from well to well.”
Matheson says the analysis predicts the API oil gravity for the reservoir, and in some cases, the gas-to-oil ratio and condensate-to-gas ratio, which can help operators understand what future production will look like.
“As part of our advanced gas analysis, we not only look at the hydrocarbon composition of the gas, but also the isotopic properties of stable carbon 13 of methane, ethane, propane, and carbon dioxide, plus hydrogen isotopes of methane, and ethane,” he adds. “That helps identify the origin, thermal maturity, and possible sources of gas, as well as evaluate reservoir compartmentalization. In conventional plays, it allows reservoir engineers, for example, to see whether the reservoir has effective seals and decide whether it makes sense to run downhole tools and complete the well.”
The gas analysis also monitors nonhydrocarbon gases such as helium, hydrogen, carbon dioxide and hydrogen sulfide, information Matheson says has many applications. For example, helium detection can indicate the presence of geological faults and fractures, as well as the degree of porosity to aid in evaluating the geological structure and reservoir petrophysics. Identifying carbon dioxide and hydrogen sulfide in reservoirs can enhance safety and planning during drilling and production.
Economics
Advanced mud gas analysis costs more than conventional analyses, but the benefits easily outweigh the incremental spend in most wells, Matheson says. “To get that same information, operators would normally need to run a downhole tool,” he explains. “We’re a fraction of the cost with quicker results.”
In wells that warrant using logging tools, Matheson says surface logging acts as insurance. If the wireline cannot get the logging tools to bottom, the operator still has the mud gas and cuttings data for the unreached area.
Ideally, Matheson says surface loggers should measure the hydrocarbons in the drilling fluid as it comes out of the well and as it moves from the mud pit back into the well. “The mud system retains a lot of hydrocarbons, especially in the United States, and especially with oil-based muds,” he says. “This means there is a high background gas effect from recycled mud.”
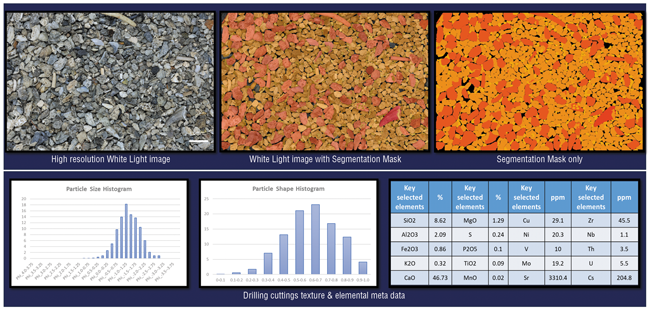
By using artificial intelligence to quantitatively analyze drill cuttings and the hydrocarbon gases contained in drilling fluids, GEOLOG says it can give operators detailed reservoir insights during drilling. These insights integrate a variety of data sources, including high-resolution white light imagery, particle size and shape distributions, and elemental and mineralogical information, allowing them to reduce subsurface uncertainty.
Matheson cautions that bit wear can distort readings in oil-based mud. “As a bit starts to dull and superheats at the drill face, it thermally cracks the hydrocarbons in the mud and converts them into contaminant mud gases that are not naturally present in rocks drilled, such as polypropylene and ethylene,” he says. “On a regular gas chromatograph, these gases overlap with the propane and ethane curves and will cause elevated readings.”
Sometimes those elevated readings can make a reservoir look exceptional at first glance. However, if the operator distinguishes between the gases from bit wear and the actual natural gas liquids, they may reach a different conclusion. Matheson says GEOLOG has developed a method to strip out the contaminant gases to allow for accurate hydrocarbon evaluation, while still being able to identify bit wear.
“By studying the contaminants, we can analyze bit wear in real time and put that information on the driller’s screen so they can make more informed decisions about when to pull out of the hole,” Matheson shares.
In making that decision, Matheson notes that drillers consider the amount that still needs to be drilled, likely bit ROP, and potential repair costs if the bit continues drilling. He describes the mud-gas-based bit wear assessment as a valuable complement to existing data and experience. “It is now a standalone service that does not require any manpower from our side and can be deployed on any rig site,” he says.
Wellbore Stability
To evaluate wellbore stability, surface loggers can monitor the amount of cuttings recovered from the well. “If the wellbore is unstable and beginning to slough, we will see more cuttings coming off the shale shaker than we would expect given the theoretical hole size. These extra cuttings are called cavings,” Matheson explains. “We will alert the operator, and they can adjust the mud weight, drilling parameters or other factors to compensate.”
If the cuttings volume falls below expectations, that could indicate a cuttings recovery problem and trigger a change in mud rheology or the pump rate, Matheson continues.
“We’re able to see problems in real time and help customers treat them quickly,” he says. “In the case of a cuttings recovery problem, that could avoid a stuck pipe situation that could cost millions of dollars and potentially force the operator to give up on the wellbore and drill a sidetrack. The potential for risk mitigation is huge compared to the cost of deployment.”
The cuttings volume data also simplifies cementing by enabling more accurate hole volume estimates, especially when wireline can’t get calipers to bottom or the hole is too wide for the calipers to measure. “Having another input for hole volume estimates makes it much easier to know how much cement the well needs,” Matheson explains.
Flowmeters
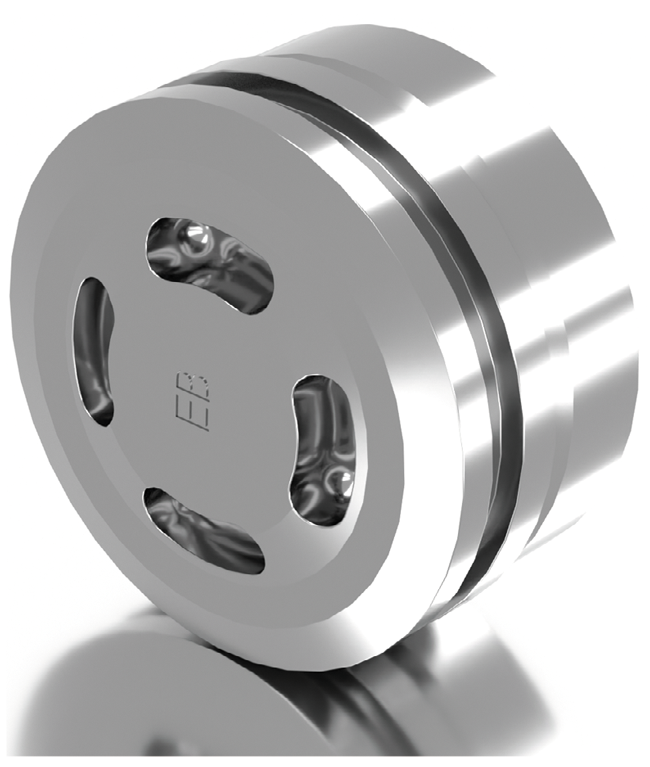
As managed pressure drilling gains popularity in the United States, Matheson says operators are looking for better ways to measure drilling mud flow rate and density. “We have developed a new meter that overcomes some of the limitations of existing flowmeters, so we can provide accurate measurements even in mud with high gas cuts or high solids concentrations.”
The wide operating range can improve safety. “When the well starts to have a gas bubble or gas influx, a conventional Coriolis meter can go out of range, which means the driller has to react while blind. With the new meter, the driller can treat the problem and get rapid feedback on whether their approach is working.”
The meter supports flow range between 10 and 1,800 gallons per minute and works in much higher gas concentrations largely because it takes multiple measurements, Matheson says. Specifically, it pairs thermal advection, which uses the transport of heat by fluid motion to infer flow characteristics, with differential pressure measurements.
In the United States, the new meter has had great success operating in high-pressure gas producer wells in Texas that are drilled with MPD control, Matheson shares. He adds that the device is building a track record in the Middle East, including from a deployment alongside a Coriolis flowmeter in order to compare the performance.
“Over seven months of continuous operation, the sensor maintained stable and accurate performance despite abrupt density changes and high gas-cut events,” several authors from the Kuwait Oil Company report in a paper presented at this year’s SPE IADC. “In contrast, the Coriolis meter experienced downtime and significant accuracy loss at elevated gas fractions, rendering flow rate estimation and transient detection unreliable.”
The authors add that the new meter reduced the pressure drop across the measurement system to one-third of that observed with Coriolis devices. Matheson says lower pressure drops can allow faster drilling in top hole sections while maintaining flow monitoring. He adds that the meter has a small footprint, making it ideal for offshore drillships or other applications with space restrictions.
“One of the models for measuring flow into the well has a pressure rating of 10,000 psi, which means we can look at the difference between mud flow rate coming out and mud flow rate pumped in more accurately than ever before,” he enthuses. “This difference can reveal the minute fluid losses that occur when drilling through open fractures, allowing us to identify where those fractures are in real time.
“We could track fractures before with other technology, but putting a flowmeter on the standpipe is a much simpler, quicker and more cost-effective way to achieve that goal,” he concludes.
Multipurpose Sensors
By embedding small, battery-powered sensors at key points in the drill string, operators and service companies can collect high-frequency data on shock, vibration and pressures that bits, motors and other components see downhole. Studying this data after runs has helped the industry gain a much deeper understanding of why drilling times vary from well to well, says Steve Jones, president and CEO of Sanvean Technologies, which is part of Scout.
Compact sensors from Sanvean Technologies can record detailed data on shock and vibration, angular velocity (RPM), temperature, and pressure during drilling. Because they can be embedded at the bit and collect higher-frequency data, Sanvean says the sensors reveal problematic drilling dynamics that would be invisible if drillers had to rely solely on shock and vibration data from measurement-while-drilling tools.
The strength of the sensors comes partly from their ability to be placed anywhere. “Historically, we would only get shock and vibration data from the MWD tool,” he says. “The MWD tool is always around the same place in the BHA. It is a good point to measure drill string dynamics, but if we want to improve drilling performance, we also need to understand drill bit dynamics.”
With that in mind, Jones generally recommends setting one sensor below the motor or RSS and one sensor above it. “The sensor at the bit will give us drill bit dynamics, and the sensor above the motor will show drill string dynamics. With that information, operators can tune their BHA designs and drilling parameters for future wells,” he explains.
The insights the sensors unlock can be valuable enough that some operators run them on every well, Jones says. “These operators are trying to push the limit, but they also want to reduce the amount of trips they have to take because of tool failures or premature bit wear,” he says. “High-frequency downhole data can help them determine where their boundaries are.”
As an example, Jones points to mud motors. “Motors degrade over time because they have rubber inside the power section,” he notes. “The harder the drilling team pushes the motor, the faster its performance falls. Using the sensor data, we can track that performance loss with various power sections, rubbers and mud types to determine over time which ones work best.”
When something goes wrong, the sensor data can be invaluable for troubleshooting, Jones adds. “Some operators run them when they begin to see problems, such as tool failures, drill string components twisting off, bits dulling prematurely or ROP falling below expectations,” he shares.
Sometimes the solution can be simple. “Quite often, tools get damaged or fail to perform right not because they are a poor fit for the well, but because the rig deviated from standard operating procedures for key operations, such as picking up off bottom, going back to bottom, and transitioning from sliding to rotating,” Jones says. “By pairing the downhole data with the information from the rig’s electronic data recorder, we can see when that’s happening.”
Secrets Revealed
In the decade since their introduction, embedded sensors have made the industry more aware of several downhole phenomena, Jones says.
“One of the most common is high-frequency torsional oscillations at the drill bit, which is high-frequency buzzing caused by the PDC cutters cutting the rock. HFTO rarely damages the bit, but it will damage whatever is right behind the bit. If that’s a rotary steerable tool, it can cause mechanical or electrical damage. If that’s a mud motor, it can damage the transmission.”
Another notable dynamic is mud motor back drive, which occurs when the bit stops moving but the mud motor continues to try to rotate it. Jones says this generates reactive torque that travels back up the drill string, causing it to curl or wrap as if it were a coiled spring.
“As the drill string wraps, it shortens,” he says. “It will actually lift the bit out of the cutting structure on the bottom of the hole, then release a huge amount of torsional energy.”
In extreme cases, that torsional energy can cause connections to part, Jones warns. In less severe situations, back drive still significantly reduces drilling efficiency. In fact, Jones says it’s not uncommon for the bit to spend several seconds idle for every second it rotates. Fortunately, Jones says, changes to the power section, bits and drilling parameters can mitigate mud motor back drive, which improves both ROP and bit life.
“A third dynamic the sensors revealed comes from mud pulse telemetry,” he says. “It occurs when the BHA includes an MWD tool above a mud motor. When the MWD tool generates a pulse, it creates a flow restriction right beside the mud motor, which causes the motor and therefore the bit to slow down.”
In most wells, Jones says this slowdown is negligible. However, it can constrain drilling performance in two situations. The first is when the drilling team plans to use a single BHA to drill the vertical, curve and lateral of a high-temperature well.
In those wells, power section fit has to be adjusted to account for the expansion that occurs as the BHA travels downhole and the temperature rises. To create an effective seal between the rotor and stator in the lateral, the seal must start small, which means it is less effective in the vertical and curve sections. This causes the motor to stall more often.
“When we look at data from embedded sensors, it’s clear that the motor stalls or microstalls when the MWD is on a pulse,” Jones says. “If the MWD isn’t pulsing as hard or if it’s using electromagnetics instead of pulses to share data, this would no longer limit performance.”
Mud pulses can also reduce performance once the motor has been in the hole long enough for the seal to degrade.
Next Steps
Recognizing the effect of heat on equipment performance, Jones says several operators and service companies in high-temperature plays, such as the Eagle Ford and Haynesville, have asked Sanvean to develop embedded sensors that can withstand 350 degrees F.
That is no easy feat for embedded sensors. “The battery, the sensor and the connection between them has to fit in a small package, and that package must achieve conflicting goals. We need the sensor to survive, but we also want it to measure shock, vibration, or pressure, so we can’t completely isolate it from those forces.”
In high-temperature applications, this balancing act becomes more complex because the package has to work even after heat enlarges the molding and other elements it contains. However, Jones stresses that difficult does not mean impossible.
“Over the past year, we’ve been working through different designs. We’re on our third iteration now, which is out in field test. If it works as we expect, we’re very close to becoming the first company to commercialize a 350 degree sensor that can go in the bit.”
Once those sensors become available, Jones predicts it will be much easier to evaluate and refine motors for high-temperature applications. “With a sensor in the bit, we have one component of a downhole dynamometer: the output RPM of the motor loaded and unloaded at temperature,” he explains. “That is valuable, because typically, when motors are tested at surface, they are run at ambient temperature or slightly above ambient temperature. I think downhole data will open a lot of eyes as to how power sections perform.”
Going Real-Time
In many wells, Jones says it would be useful to see bit dynamics in real time. “Everybody likes to call shale development factory drilling, but the reality is that there are a lot of BHAs that get pulled out of hole every day because differences in the downhole environment or the operation caused unexpected tool failure or excessive bit wear,” Jones says. “In areas where the industry has not yet figured out how to consistently drill the entire well in one run, more real-time data could be the key.”
To provide that information, Sanvean has teamed up with Scout to embed sensors inside mud motors. “We mount the sensors in the rotor,” Jones explains. “Because the rotor is directly coupled to the drill bit, the sensor can get drill bit dynamics, including the output speed, the torsional dynamics and stick slip, and the shock. The shock values may be slightly lower than they would be at the bit, but they still indicate whether the shock is higher or lower.”
A transmitter at the top of the rotor catch sends this data to a receiver on the MWD tool. “It can’t transmit everything,” Jones notes. “Instead, we take the high-frequency data and code it into buckets of information about what’s going on. For example, we monitor the frequencies we’re seeing and the magnitude of change for torsional oscillations, stick slip or three-axis shock, then send that information in a way that’s usable at the surface to make decisions.”
In addition to sharing real-time drill bit dynamics, the intelligence-gathering motors can provide two other data points, both of which support geosteering. The first is inclination.
“We’ve added an inclinometer at the base of the rotor, meaning it’s only 12-15 feet from the bit, depending on the motor,” Jones says. “That proximity can allow the driller to react more quickly to changes.”
The second is pseudo-gamma ray data. This simulated data comes from three-axis shocks at the bit, which only correlate with actual gamma ray readings in carbonate formations such as the Permian. But in those formations, Jones says the pseudo-gamma can be quite accurate. As with the inclination readings, the fact that they originate at the bit instead of the MWD tool means the driller sees changes earlier.
Scout and Sanvean began thinking about how to deliver real-time insights seven years ago, Jones shares. “We’ve been secretly embedding the sensors in our motors for a long time to get the measurements to a point where they would be good enough to guide real-time decisions. About three years ago, we started turning on real-time transmission and hooking it up to various MWD tools.
“Today, we’re comfortable with the measurements and the transmission’s reliability,” Jones says. “We are still integrating with certain MWD tools, but we’re about to hit the customer validation stage of development. Customers are used to real-time drill string dynamics but not drill bit dynamics, so we’ll need to help them become familiar with that data and figure out how to use it to optimize drilling.”
Jones predicts the data will be a game changer for mud motor runs in many basins. He points out that even wells on the same pad can have drastically different performance. “Even when the only difference from well to well is the direction, things change,” he says. “Being able to make adjustments based on real-time information could prolong bit and BHA life, eliminating many unplanned trips.”
For other great articles about exploration, drilling, completions and production, subscribe to The American Oil & Gas Reporter and bookmark www.aogr.com.