


Case Study
Tracers Validate Production Techniques
By Elspeth M. Crawford, Chad W. Senters, Kenneth E. Bullard, Richard S. Leonard and Robert A. Woodroof
HOUSTON–The Granite Wash continues to be a prolific hydrocarbon producer. More than 1,000 horizontal wells have been drilled and completed over the past seven years in the deep Anadarko Basin in Roger Mills, Beckham, Washita and Custer counties, Ok., as well as Wheeler County, Tx. By the end of 2013, cumulative production from 1,048 horizontal wells in the play had reached 69.6 million barrels of oil and 1.5 trillion cubic feet of natural gas.
LINN Energy initiated an extensive Granite Wash development program in 2012, in which 144 horizontal wells were drilled and completed in 2012 and 2013 with multistage hydraulic fracturing. Many of those wells utilized various types of completion diagnostics to evaluate vertical and horizontal communication within the Granite Wash in order to identify potential horizontal loading problems, and to diagnose long-term fracture fluid movement.
This article reviews more than two years of water-based fracturing fluid tracer data, and details how the individual tracers were used to quantify communication among various layers of the Granite Wash and between nearby wells.
Extended sampling of individual fluid tracers can be an extremely useful tool for explaining production anomalies. On this project, the operator was able to identify the source of production changes and determine the best well intervention technique to economically increase production.
In addition, the analysis compared toe-stage frac fluid recoveries to identify wells that appeared to be constrained. The data documented specific cases of interwell and interzonal communication, including offset wells that had been on production prior to the fracturing treatment and offset wells that were drilled after.
The Texas/Oklahoma Granite Wash is composed of a series of heterogeneous arkosic sandstones and conglomeratic sediments that were deposited in the basin during the denudation of the Amarillo Uplift. The resulting deposits represent a stratigraphic inversion of the original uplift strata.
Granite Wash detrital grains were derived from granite, rhyolite, gabbro, sandstone, chert, limestone, and dolomite source rocks, which is evidenced by the amount of quartz, K-feldspar, plagioclase feldspar, calcite, chert, and rock fragments within these sediments. These Granite Wash zones were deposited northward into the Anadarko Basin as fan delta and submarine fan accumulations. The primary reservoir developments in this area are situated within channelized deposits of submarine fan complexes.
Completion diagnostics are used to optimize a variety of drilling and completion practices across many conventional and unconventional hydrocarbon plays. Specifically in this project, fluid tracers were used to evaluate completion and production techniques, leading to optimized Granite Wash wells.
Tracer Background
Fluid tracing involves pumping unique, water-based tracers in the pad and in the proppant-laden fluid of each stimulated stage. After fracture operations are completed, water samples from the flow-back stream are caught and analyzed with gas chromatography/mass spectrometry technology, and the data are presented in a digitally formatted report. This report shows the concentration of the tracer in parts per billion of each individual fluid tracer that was pumped at particular flow-back volumes and elapsed times.
Shading in the tables presented is based on the individual concentration values and moves from cool colors (purple/blue) to warmer colors (yellow/red) as the concentration increases. Tables are outputs of the digitally formatted report. This provides a way to quickly see the overall trend of the tracer flow back. Fluid tracers are used to help evaluate flow-back efficiency, identify potential wellbore loading issues, and quantify offset well fracture fluid communication.
Every well discussed in this paper utilized fluid tracers.
During the stimulation treatment, fluid tracers were injected into the water-based fluid at the surface at a set concentration. When the well is cleaning up and on production, water samples are collected at the surface and sent to a laboratory for analysis. The lab uses gas chromatography/mass spectrometry to determine which fluid tracers are present in the sample and at what concentration. The typical sampling period for fluid tracing is 30 days. However, there were useful data collected after years of production from all the wells in this project.
Monitoring Program
Of the 180 Granite Wash wells traced, more than 100 used more than one tracer each. In all, 39 percent of the 180 wells used one tracer, 44 percent used two-four tracers, and 17 percent used five or more.
A majority of the wells utilized a single tracer in the toe stage, verifying that the toe stage was responding and was included in the well’s production, and indicating that the lateral was clear. Samples typically are collected from the treatment well on a quarterly schedule, as well as when the treatment well becomes the offset well to future stimulation projects. The timing of sample collection is adjusted as the well’s sample concentration decline curve flattens.
As the cost of water increases, or water availability decreases, recycling frac fluid becomes a necessity. Fluid tracers are affected by dilution. The recycled fluid contains a small remnant of the tracer pumped during the stimulation treatment. Pre-frac water samples account for any tracer present prior to injecting tracer into the treatment well in recycled fluid.
Many of the wells from which the recycled fluid originates utilized fluid tracers during their stimulation treatments, making it difficult to evaluate offset well communication for wells with minimal communication. Significant or substantial communication, as reflected in measured tracer concentrations, easily contrasts with the prefrac tracer concentrations.
Completion Diagnostics
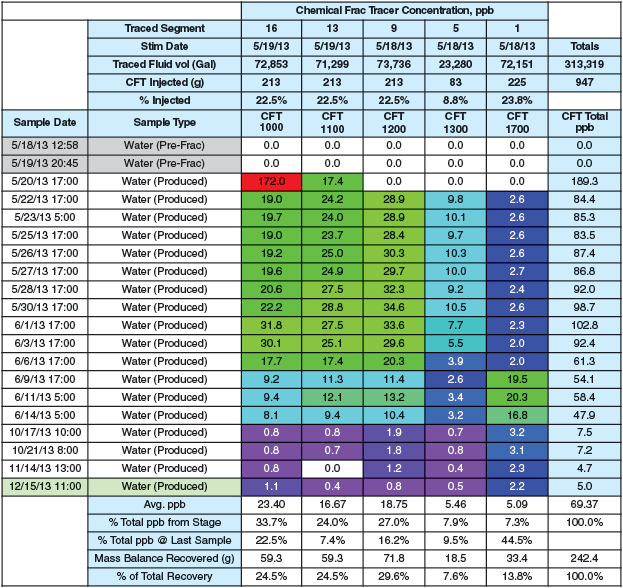
An example of a project that used completion diagnostics to test the results of changing a completion design is the Z5H well. The Z5H utilized three unique fluid tracers injected into each one-third of the stimulated lateral. The objective of this project focuses on analyzing distribution of load recovery from each traced section of the wellbore to determine potential design optimization.
TABLE 1
Traced Well Z5H Showing Equal Contribution through Lateral
Multicluster plug-and-perforate completion techniques comprise the majority of the completions in the Granite Wash. The Z5H utilized a single point-of-injection technique for each stage along the wellbore.
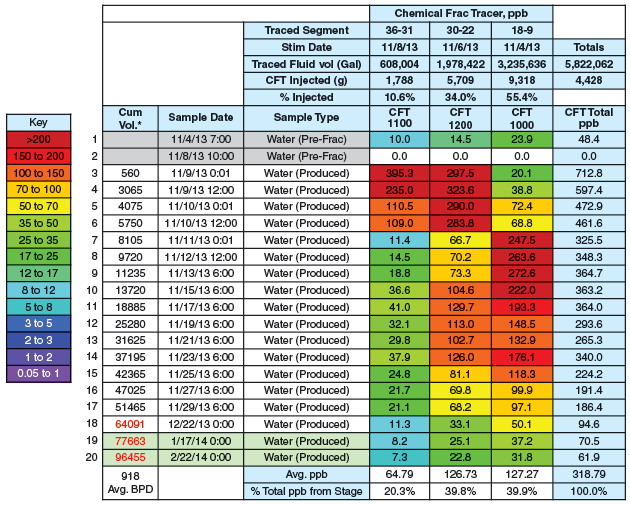
Table 1 shows the concentration of the tracer recovered over time for each section of the lateral traced. The color scheme illustrates the concentration for each traced segment. The warmer colors (red, orange, yellow) represent higher tracer concentrations, while the cooler colors (green, blue, purple) represent lower tracer concentrations.
The dataset for Z5H follows a typical load recovery trend, with the heel initially recovering higher concentrations than the toe, then switching to toe-dominated recovery. After 10 days of load recovery on Z5H, the data are consistent with the initial concept that using a single point of injection for each stimulation stage can result in even recovery of the load fluid.
A stacked lateral test was conducted to further test the areas of exploration and the most appropriate number of wells to place in each section. In the Granite Wash, multiple lineaments are targets. In the past, this was done through vertical development; today it is done with horizontal wells.
The question then becomes: How many formations can be reached with a single lateral and its stimulation? To test the boundaries during hydraulic fracturing, a completions test was conducted. Two wells were located on the same pad, targeting different formations with a known barrier between them. Both laterals were traced and sampled extensively during flow back and production to identify potential communication between the two wells.
TABLE 2
Offset Vertical Well with Communication from Both Horizontals
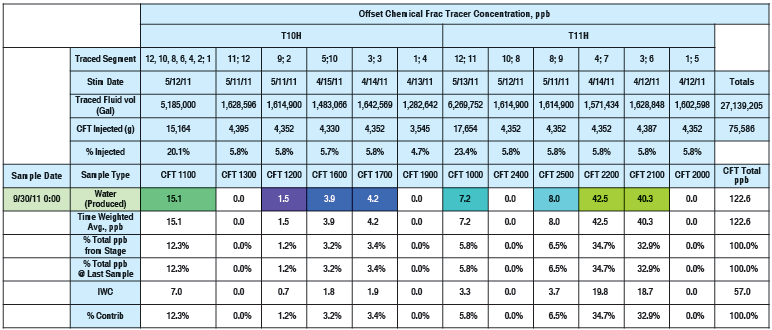
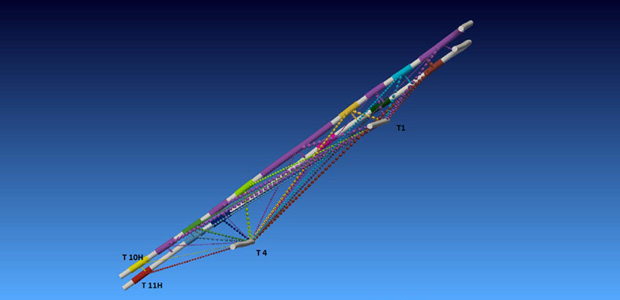
The laterals were separated vertically by 125 feet, on average. The tracing results of the horizontal wells, shown in offset communication Table 2, illustrate the communication between the horizontal wells.
The section in development has four vertical wells on either side of the two horizontal wells. All have been on production from both targeted zones for more than 20 years. Further sampling on two of these vertical wells after completing the hydraulic fracturing treatment shows that the communication most likely occurred through the vertical wells.
FIGURE 1
Map View of Wells Tested and Likely Paths of Communication
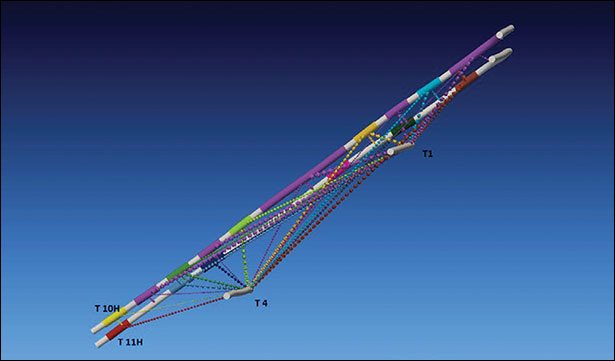
FIGURE 2
P4H Increase in Production After Mill-Out
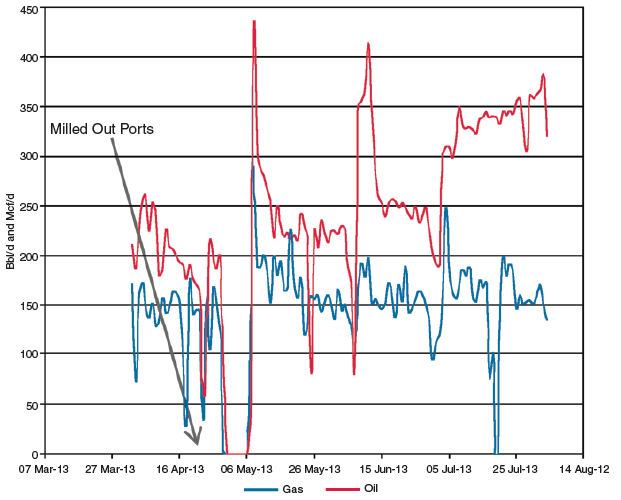
Figure 1 illustrates the likely path of the communication, as does the communication matrix in Table 2. Within three months, the vertical communication concentration observed in the offset vertical pairs declined to negligible “background” levels.
Tracer Longevity
Fluid tracers are affected primarily by dilution. Thus, they continue to provide useful data over time. The decision to continue to sample wells for a significant amount of time after the effectiveness of the initial flow profile has been established continues to provide useful data on both treatment and offset wells for both completion tests and production. The P4H well utilized an open-hole completion technique, and fluid tracers were applied in four segments of equal lateral length.
The main objective for running completion diagnostics on the P4H was to evaluate the economics of running a mill-out intervention. Standard practice for operators in the area is to not mill out the ball ports, assuming there is limited restriction of flow to surface. The initial water samples showed no contribution from three quarters of the well, and only the heel stages unloaded frac fluid.
The lack of flow-back contribution from the majority of the lateral justifies a decision to mill out the ports, enabling the entire lateral to contribute. Figure 2 shows the production prior to milling the ports and after. An increase in oil and gas production rates on completion of the milling intervention confirms an obstruction has been removed from the wellbore.
Interwell Communication
The interwell communication test focused on two wells. The K1H was completed six months prior to the T3H, and was traced for interwell communication and to confirm flow. The extent of interwell communication is unknown in the area tested. The wells were traced to establish whether there might be interference.
Table 3 shows tracer recovered from the K1H. There is no measurable transfer between the two wells for any of the stages traced.
TABLE 3
Tracer Communication of T3H in the Mature Offset K1H
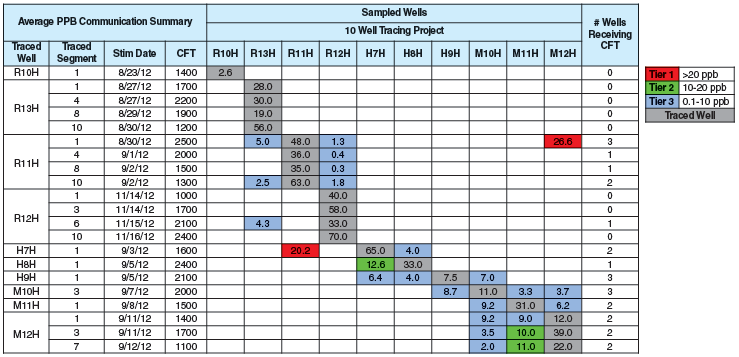
A 10-well project completed in 2012 utilized three stimulation fleets simultaneously fracturing across three sections (Figure 3). The communication matrix (Table 4) shows the average communication among the 10 wells in the project. The level of communication is considered significant when the average concentration of the offset well exceeds 50 percent of the average concentration recovered in the treatment well.
FIGURE 3
Initial Average Communication of the 10 Wells
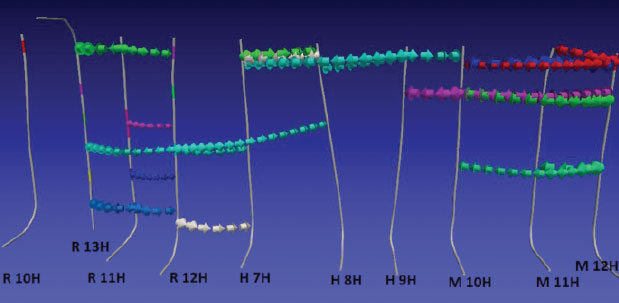
As illustrated in Figure 3, the wells stimulated last tend to receive higher average communication values for communication that occurs within the sampling period. This may be the result of energy stored from the stimulation performed. For example, during the project, well R10H was stimulated first, and interwell communication was not evident to this well from any of the traced stages in the 10 wells. This indicates that the stimulation order may affect the resulting interwell communication.
A 3-D representation of average communication of 10 wells in the Granite Wash verifies effective stimulation of the targeted interval while preserving the integrity of each well stimulated. When comparing the average communication with the order in which the wells were stimulated and the targeted drilling interval, there is a tendency for less interwell communication to occur more so based on time. There is also a tendency for the toe section to communicate with offset wells when the toes of the two wells are relatively close to each other.
TABLE 4
Communication Matrix for the 10 Wells
Results
In total, the operator traced 185 wells between 2010 and 2014 in the Granite Wash. The tracer data confirm that recycled water can be utilized since background tracer data can be confirmed prior to use, and new completion techniques can be tested for well response and even flow regimes. Moreover, interwell communication can be evaluated with mature wells and fresh, offset infill wells.
The project demonstrates that both short-term and long-term projects can be evaluated efficiently with fluid tracers, and that boundary limitations can be tested with stacked laterals.
Initial flow back can give guidance on the next step required for the health of the well, indicating whether assistance is required, or whether the well can flow on its own for some time.
In addition, nonproductive portions of the lateral can be identified quickly and remediation can be performed to maintain consistent production. The operator can confirm that the wellbores are clear of extensive scale and obstructions, with validation of flow from the toe stage.
ElsPeth M. Crawford served for four years as a senior engineer at LINN Energy LLC before joining Saudi Aramco as a petroleum engineer in December. At LINN, Crawford’s work focused on completions in horizontal plays in the Panhandle and western Oklahoma, including the Granite Wash. Prior to that, she was a project manager at Pinnacle Technologies and a field engineer at Halliburton. A member of the Society of Petroleum Engineers, she holds a B.S. in chemical engineering from the University of Mississippi.
Chad w. Senters is a region engineering adviser for ProTechnics, a division of Core Laboratories, specializing in completion diagnostics. He has eight years of experience in the oil and gas industry, including stimulation, coiled tubing and downhole tools. Senters graduated from the University of Missouri Rolla with a B.S. in chemical engineering, and is a member of the Society of Petroleum Engineers.
Kenneth E. Bullard is the account manager for ProTechnics in Oklahoma City, specializing in completion diagnostics. He has more than 30 years of experience in the oil and gas industry, including wireline and stimulation. Prior to joining ProTechnics in 2000, Bullard worked for Cardinal Surveys in Odessa, Tx. He is a member of the Society of Petroleum Engineers.
Richard S. Leonard is director of engineering diagnostics at ProTechnics. He previously served as senior technical adviser, sales engineer, and business development manager. Before joining the company in 1999, Leonard served 18 years as an engineering supervisor for Union Pacific Resources. He began his career as a petroleum engineer at Pennzoil. A member of the Society of Petroleum Engineers, he holds a B.S. in petroleum engineering from the University of Texas at Austin.
Robert A. Woodroof is the technical manager for ProTechnics. He joined the company in 1995 after spending 23 years with The Western Company/BJ Services in various research and development, and technical management positions in Fort Worth and Houston. Woodroof obtained a B.S. in chemistry from the University of Texas at Arlington. He is a distinguished member of the Society of Petroleum Engineers.
For other great articles about exploration, drilling, completions and production, subscribe to The American Oil & Gas Reporter and bookmark www.aogr.com.